How to teach ROOT to colour in between the lines in graphs?

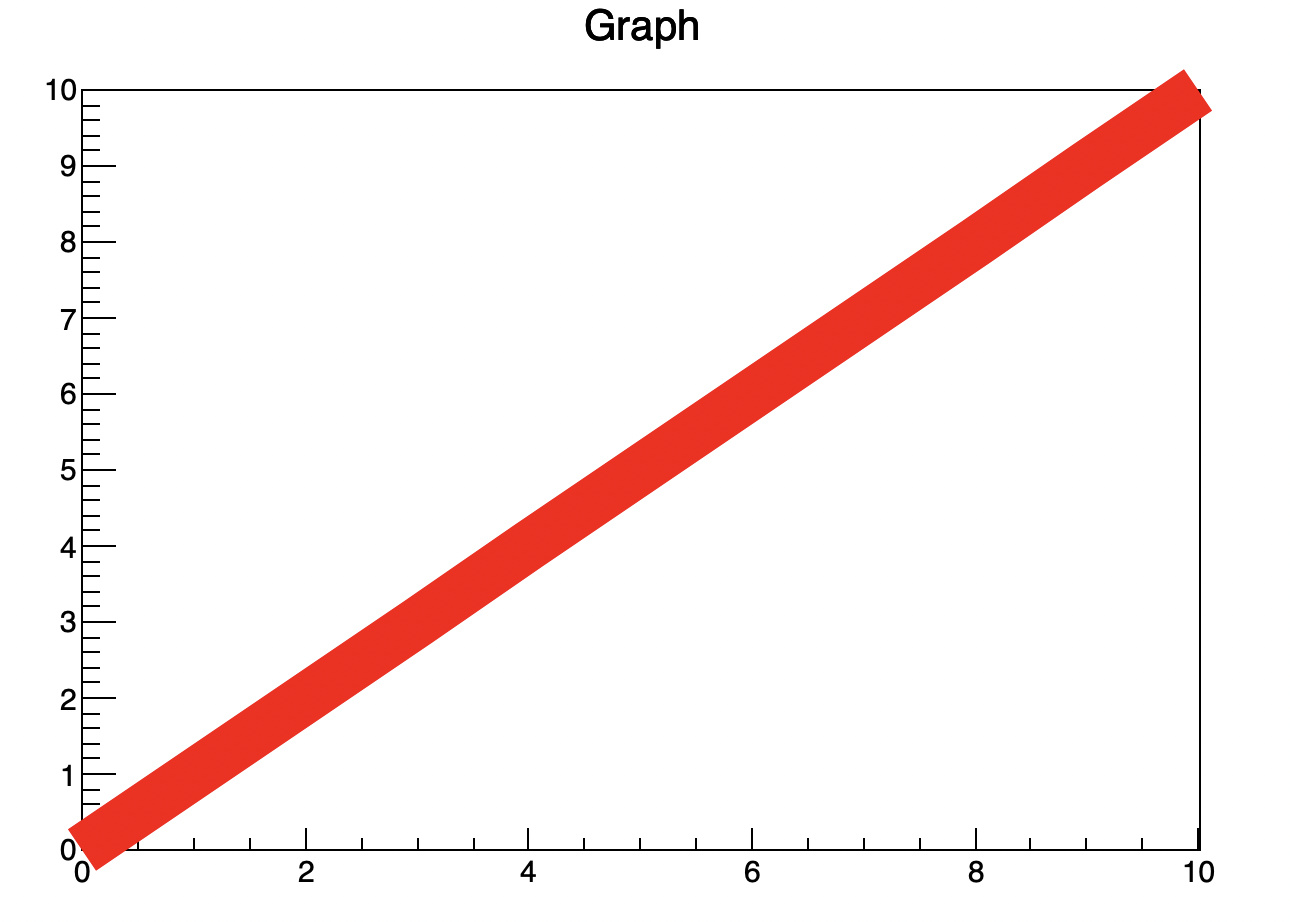
The following code should plot a straight line (which it does):

void plotTest(){

 TCanvas *c1 = new TCanvas("c1","c1",200,10,700,500);
 double x[11] = {0,1,2,3,4,5,6,7,8,9,10};
 double y[11] = {0,1,2,3,4,5,6,7,8,9,10};

 TGraph* gr1 = new TGraph(11,x,y);
 gr1->GetXaxis()->SetRangeUser(0,10);
 gr1->GetYaxis()->SetRangeUser(0,10);
 gr1->SetLineWidth(4);
 gr1->SetLineColor(kRed);
 gr1->Draw("AL");

 gPad->RedrawAxis();
 c1->RedrawAxis();

 gPad->Print("TEST.pdf)");
}

However the output of this is attached.TEST.pdf (13.2 KB)

Looking at where the line meets the axes, the line colours outside of the plot

. I thought redrawing the axis would fix this, but it does not. How do I fix this?

Thanks,
Jack

Yes this is because you use a thick line. I will see what to do.

void RedrawFrame() {
   gPad->Update();
   gPad->RedrawAxis();
   double x1  = gPad->GetUxmin();
   double x2  = gPad->GetUxmax();
   double y1  = gPad->GetUymin();
   double y2  = gPad->GetUymax();
   TLine *l   = new TLine();
   l->DrawLine(x2,y1,x2,y2);
   l->DrawLine(x1,y2,x2,y2);
}

void plottest(){
   TCanvas *c1 = new TCanvas("c1","c1",200,10,700,500);
   double x[11] = {0,1,2,3,4,5,6,7,8,9,10};
   double y[11] = {0,1,2,3,4,5,6,7,8,9,10};

   TGraph* gr1 = new TGraph(11,x,y);
   gr1->GetXaxis()->SetRangeUser(0,10);
   gr1->GetYaxis()->SetRangeUser(0,10);
   gr1->SetLineWidth(4);
   gr1->SetLineColor(kRed);
   gr1->Draw("AL");

   RedrawFrame();

   gPad->Print("test.pdf)");
}

Hi @couet , thanks very much this solves the line where it is exactly at the axis, but the line still extends outside the axis, is there a way to fix this?

Thanks

void RedrawFrame() {
   gPad->Update();
   double x1  = gPad->GetUxmin();
   double x2  = gPad->GetUxmax();
   double y1  = gPad->GetUymin();
   double y2  = gPad->GetUymax();
   double dx  = 0.01*(x2-x1);
   double dy  = 0.01*(y2-y1);

   TBox *b = new TBox();
   b->SetFillStyle(1001);
   b->SetFillColor(0);
   b->SetLineColor(0);
   b->DrawBox(x2-dx, y2, x2, y2+dy);
   b->DrawBox(x2, y2-dy, x2+dx, y2+dy);
   b->DrawBox(x1, y1-dy, x1+dx, y1);
   b->DrawBox(x1-0.5*dx, y1-dy, x1, y1+dy);

   gPad->RedrawAxis();

   TLine *l   = new TLine();
   l->DrawLine(x2,y1,x2,y2);
   l->DrawLine(x1,y2,x2,y2);
}

void plottest(){
   TCanvas *c1 = new TCanvas("c1","c1",200,10,700,500);
   double x[11] = {0,1,2,3,4,5,6,7,8,9,10};
   double y[11] = {0,1,2,3,4,5,6,7,8,9,10};

   TGraph* gr1 = new TGraph(11,x,y);
   gr1->GetXaxis()->SetRangeUser(0,10);
   gr1->GetYaxis()->SetRangeUser(0,10);
   gr1->SetLineWidth(4);
   gr1->SetLineColor(kRed);
   gr1->Draw("AL");

   RedrawFrame();

   gPad->Print("test.pdf)");
}

Note that the bottom left corner had to be fixed also.

Hi @couet thanks, this solves the problem were the line is outside right at the corners though I was hoping for a more general solution rather than having to manually draw over wherever the line goes outside the plot, is it not possible to prevent the line being plotted outside of the plot area anywhere?

You have thick lines and the angle they come to the corner can be anything. You can also have a thicker line frame, that might be more general. The line itself doe not go outside the plot it’s the thickness of the line which goes out. It is more visible if you make a very thick line.

void plottest(){
   TCanvas *c1 = new TCanvas("c1","c1",200,10,700,500);
   double x[11] = {0,1,2,3,4,5,6,7,8,9,10};
   double y[11] = {0,1,2,3,4,5,6,7,8,9,10};

   TGraph* gr1 = new TGraph(11,x,y);
   gr1->GetXaxis()->SetRangeUser(0,10);
   gr1->GetYaxis()->SetRangeUser(0,10);
   gr1->SetLineWidth(50);
   gr1->SetLineColor(kRed);
   gr1->Draw("AL");
}

Yes I realise the problem is the thickness, but I think it would be good if there was a solution to it. This is an extremely common problem for everyone that uses ROOT (practically every single paper that has plots that use ROOT experiences this problem, e.g. looking at just the most recent hep-ex paper https://arxiv.org/pdf/2002.08229.pdf there are multiple plots with this problem, one example here

. Is this not something that is solvable?

The only way I can see is to have a frame/axis at least as thick as the lines.
If you can think of a better solution let me know.

Is it not possible for the draw() function to check if the thickness of the line extends outside of the plot area and cull it? I assume the draw() function already does this for the points (otherwise the lines would keep going outside further).

The clipping does not (cannot) take care of the line thickness. Moreover it is something very dependent of the back end use (PDF, PDF, Screen Svg Png…) . I am not aware of any graphing systems doing that. But of you know one I would be very interested to study it. For example here is a graph I did with “numbers” on Mac (Excel for Mac). Thick lines behave the same as in ROOT when they are on the axis.

If there’s no way to check if the thickness extends outside I suppose it would be possible for draw() to draw everything that should be inside the plot first, then draw some white boxes around the outside of the plot area to go on top of anything extending outside, before finally drawing the things that should be outside the plot area?

Yes that’s a way but it is very heavy and cannot be done by default for all the plots.
This kind of thing can be done inside a user macro to produce plots for publication.
There is other way like having a thicker frame or slightly shift le axis limits to give space to
the thick lines. Different user may have different choices.

Ah ok, well thanks anyway

Cheers,
Jack

This topic was automatically closed 14 days after the last reply. New replies are no longer allowed.