Hello, can someone please let me know how to place two histograms vertically in the same canvas?
For example, my goal is to make a plot like the picture below:

Look at the Y-axis, the labels of the top histogram’s Y-axis is displayed completely ( 10^{0} is shown). But when I tried to use ROOT to plot them, I got this:
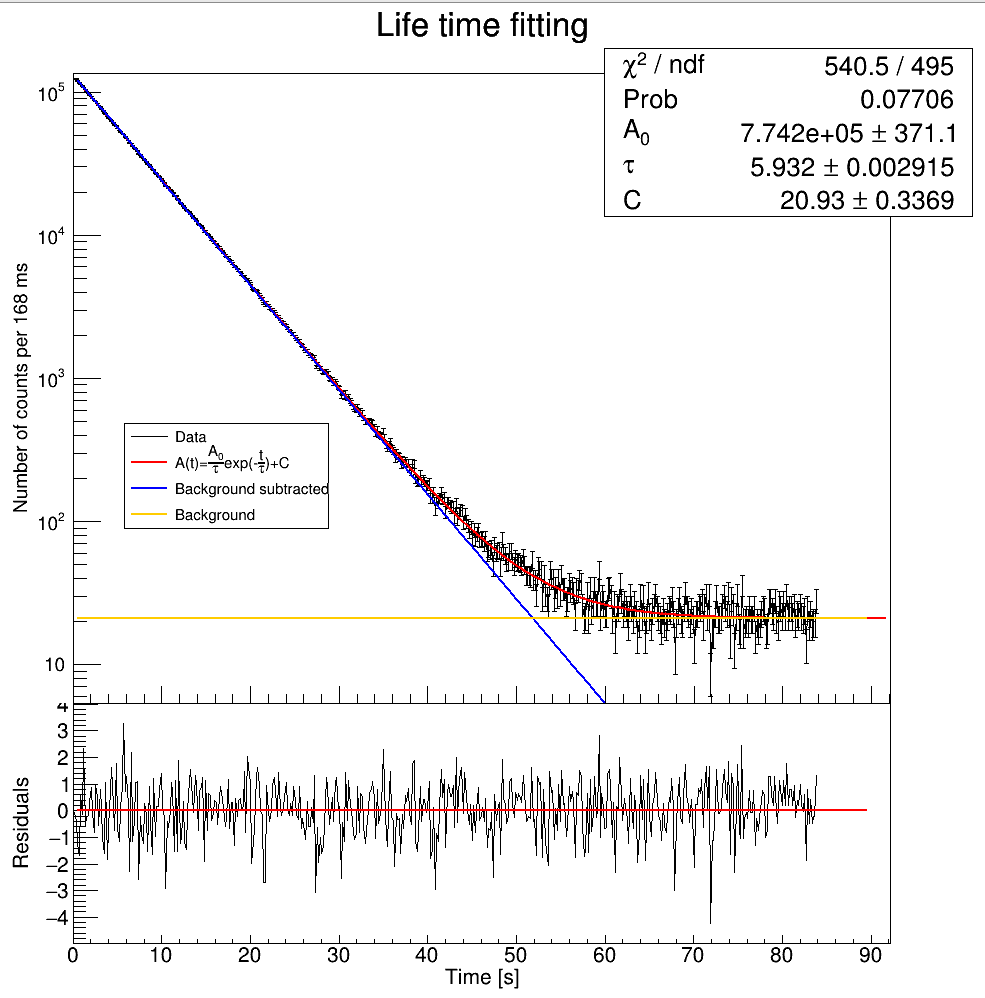
The labels of the Y-axis are not fully displayed (the intersection between the top and bottom histograms, e.g., the number “4” on the bottom histogram’s Y-axis is partially shown).
How can I solve this problem? Here below is my code.
int main(int argc, char **argv)
{
    gStyle->SetOptFit(1111);
    TApplication app("app", &argc, argv);

    const Int_t nBins = 500;
    Double_t totalTime = 84.;
    Double_t binWidth = totalTime / (Double_t)nBins;
    std::array<Double_t, nBins> count;
    std::array<Double_t, nBins> countVar;

    std::unique_ptr<TGraphErrors> gr1(new TGraphErrors(nBins));
    gr1->SetName("gr1");
    gr1->SetTitle("Life time fitting");
    gr1->GetYaxis()->SetTitle("Number of counts per 168 ms");
    gr1->GetYaxis()->SetTitleFont(43);
    gr1->GetYaxis()->SetTitleSize(20);
    gr1->GetYaxis()->SetTitleOffset(1.6);
    gr1->GetYaxis()->CenterTitle();
    gr1->GetYaxis()->SetLabelFont(43);
    gr1->GetYaxis()->SetLabelSize(20);

    std::string dataFile = "../p29-spectrum-428009759.asc";
    std::ifstream dataStream(dataFile.c_str());
    dataStream >> count[0] >> countVar[0]; // skip the first line

    Int_t nLines = 0;
    while (!dataStream.eof())
    {
        dataStream >> count[nLines] >> countVar[nLines];
        gr1->SetPoint(nLines, (Double_t)nLines * binWidth, count[nLines]);
        gr1->SetPointError(nLines, 0.0, std::sqrt(countVar[nLines]));
        nLines++;
    }
    gr1->RemovePoint(0);
    gr1->RemovePoint(0);

    std::unique_ptr<TF1> f1(new TF1("f1", "[0]/[1]*TMath::Exp(-x/[1])+[2]", 0., 90.));
    f1->SetParameters(1.27e5/6., 6.01, 2.0e+01);
    f1->SetParNames("A_{0}", "#tau", "C");
    f1->SetLineColor(kRed);
    TFitResultPtr fitResult = gr1->Fit("f1", "S");
    fitResult->Print("V");

    std::unique_ptr<TF1> f1_pure(new TF1("f1_pure", "[0]/[1]*TMath::Exp(-x/[1])", 0., 90.));
    f1_pure->SetParameters(f1->GetParameter(0), f1->GetParameter(1));
    f1_pure->SetLineColor(kBlue);

    std::unique_ptr<TF1> f1_bg(new TF1("f1_bg", "[0]", 0., 90.));
    f1_bg->SetParameter(0, f1->GetParameter(2));
    f1_bg->SetLineColor(kOrange);

    std::unique_ptr<TGraph> gr2(new TGraph(nBins));
    gr2->SetName("gr2");
    gr2->SetTitle("");
    gr2->GetXaxis()->SetTitle("Time [s]");
    gr2->GetXaxis()->SetTitleFont(43);
    gr2->GetXaxis()->SetTitleSize(22);
    gr2->GetXaxis()->CenterTitle();
    gr2->GetXaxis()->SetLabelFont(43);
    gr2->GetXaxis()->SetLabelSize(22);
    gr2->GetYaxis()->SetTitle("Residuals");
    gr2->GetYaxis()->SetTitleFont(43);
    gr2->GetYaxis()->SetTitleSize(22);
    gr2->GetYaxis()->SetTitleOffset(1.5);
    gr2->GetYaxis()->CenterTitle();
    gr2->GetYaxis()->SetLabelFont(43);
    gr2->GetYaxis()->SetLabelSize(22);
    for (int i = 2; i < nBins; i++)
    {
        gr2->SetPoint(i, (Double_t)i * binWidth, (count[i] - f1->Eval((Double_t)i * binWidth)) / std::sqrt(countVar[i]));
    }
    std::unique_ptr<TF1> f2_zero(new TF1("f2_zero", "0", 0., 90.));
    f2_zero->SetLineColor(kRed);

    std::unique_ptr<TCanvas> c1(new TCanvas("c1", "c1", 1024, 1024));
    c1->cd();

    TPad *pad1 = new TPad("pad1", "pad1", 0.0, 0.3, 1., 1.);
    pad1->SetBottomMargin(0.); // Upper and lower plot are joined
    pad1->SetLogy();
    pad1->Draw(); // Draw the upper pad: pad1
    pad1->cd();

    gr1->Draw("alp");
    f1->Draw("same");
    f1_pure->Draw("same");
    f1_bg->Draw("same");
    std::unique_ptr<TLegend> l1(new TLegend(0.15, 0.25, 0.35, 0.4));
    l1->AddEntry("gr1", "Data", "l");
    l1->AddEntry("f1", "A(t)=#frac{A_{0}}{#tau}exp(-#frac{t}{#tau})+C", "l");
    l1->AddEntry("f1_pure", "Background subtracted", "l");
    l1->AddEntry("f1_bg", "Background", "l");
    l1->Draw("same");

    c1->cd();
    TPad *pad2 = new TPad("pad2", "pad2", 0., 0., 1, 0.3);
    pad2->SetTopMargin(0);
    pad2->SetBottomMargin(0.2);
    pad2->Draw();
    pad2->cd();
    gr2->Draw();
    f2_zero->Draw("same");

    c1->Update();
    c1->SaveAs("c1.png");

    app.Run();
    return 0;
}
Another question is about the font size. When I was plotting using two TPad whose size are different, I need to manually adjust the font size by eyeballing. Is there a way to automatically make the label font size of the two histograms visually the same?
Thanks!
_ROOT Version: 6.28/04
_Platform: Fedora
_Compiler: GCC12.1