Thanks.
ROOT Version: 6.18.02
Platform: Gentoo Linux
Compiler: GCC 9.2.0
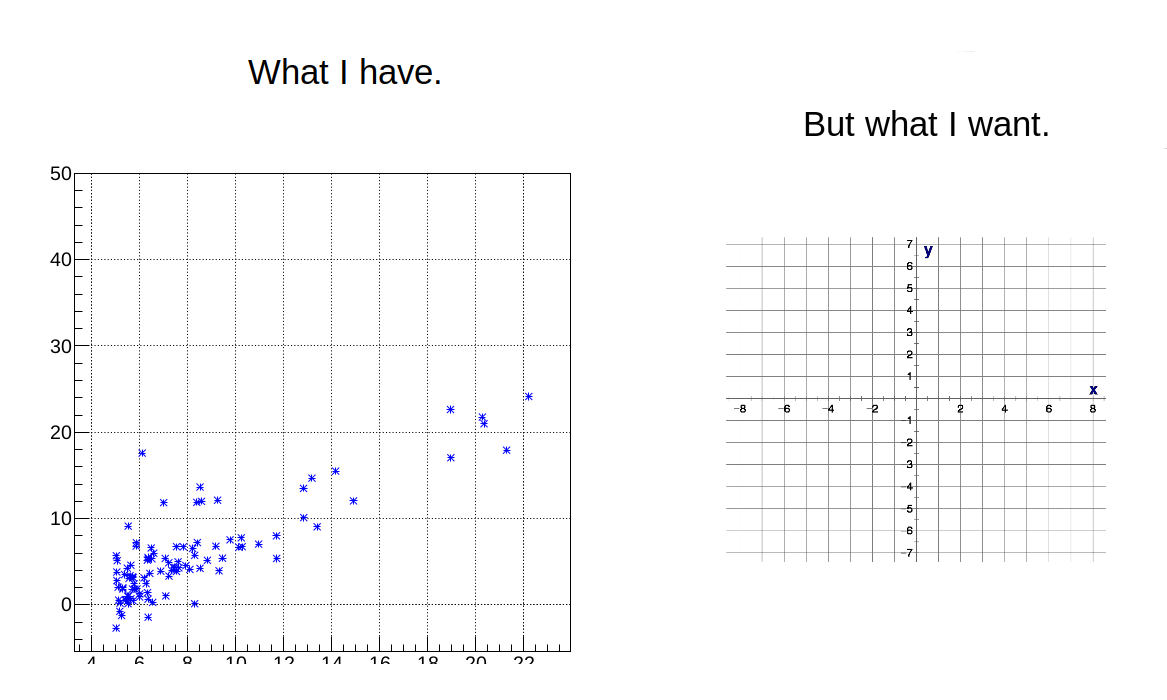
I am not sure the title of your post matches the plots you posted. Anyway, here is an example showing a way to obtain a plot similar to the one you want. Let me know if you need more details.
{
   TCanvas *c1 = new TCanvas("c1", "Test",800,600);
   c1->Range(-1.5,-0.5,1.5,1.5);
   TF1 myfunction("myfunction","x*x",-1.,1.);
   myfunction.Draw("same");
   TGaxis *Xaxis = new TGaxis(-1.,0.,1.,0.,-1.,1.,510," ");
   Xaxis->Draw();
   TGaxis *Yaxis = new TGaxis(0.,-0.2,0.,1.2,-0.2,1.2,510," ");
   Yaxis->Draw();
}
This topic was automatically closed 14 days after the last reply. New replies are no longer allowed.