Can you post the macro producing this plot ? it will be easier to modify it directly.
{
TCanvas *c1 = new TCanvas("c1","c1",600,400);
TGraphErrors *gr =new TGraphErrors();
gr->SetTitle("Graph");
gr-> GetXaxis()->SetTitle("alpha");
gr-> GetYaxis()->SetTitle("Cross Section");
double x , y , ex ,ey;
int n = 0 ;
n= gr->GetN();//take actual nbr of data file
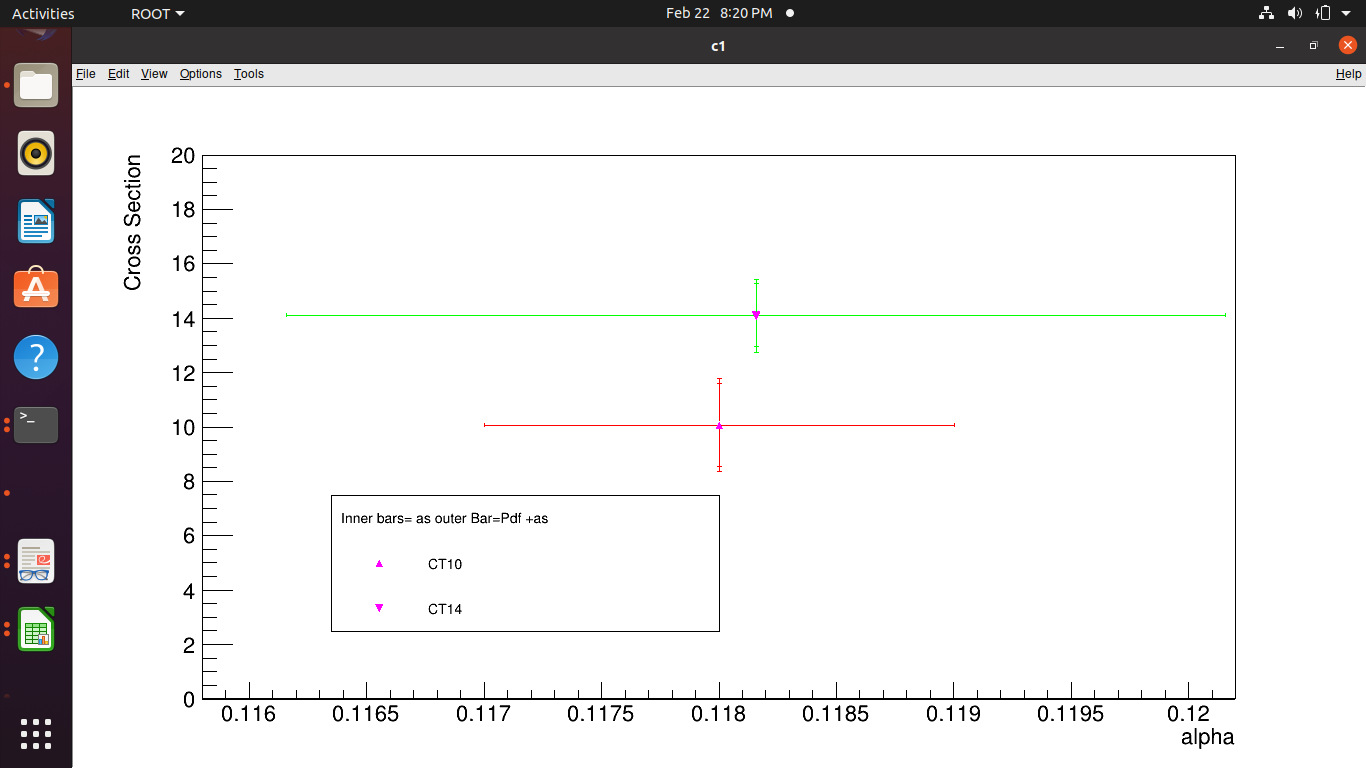
gr->SetPoint(n,0.118001,10.07);//for defining the point
gr->SetPointError(n ,0.001 ,1.53);
gr->SetLineColor(2);
gr->SetMarkerColor(6);
gr->SetMarkerStyle(22);
gr->Draw();
TGraphErrors *gr1 =new TGraphErrors();
double x1 , y1 , ex1 ,ey1;
int m = 0 ;
m= gr1->GetN();//take actual nbr of data file
gr1->SetPoint(m,0.118001,10.07);//for defining the point
gr1->SetPointError(n ,0.0 ,1.71);
gr1->SetLineColor(2);
gr1->SetMarkerColor(6);
gr1->SetMarkerStyle(22);
gr1->Draw();
TGraphErrors *gr2 =new TGraphErrors();
double x12 , y12 , ex12 ,ey12;
int p = 0 ;
p= gr2->GetN();//take actual nbr of data file
gr2->SetPoint(p,0.118,10.58);//for defining the point
gr2->SetPointError(n ,0.002 ,1.15);
gr2->SetLineColor(3);
gr2->SetMarkerColor(6);
gr2->SetMarkerStyle(23);
gr2->Draw();
TGraphErrors *gr3 =new TGraphErrors();
double x122 , y122 , ex122 ,ey122;
int q = 0 ;
q= gr3->GetN();
gr3->SetPoint(q,0.118,10.58);
gr3->SetPointError(n ,0.0 ,1.34);
gr3->SetLineColor(3);
gr3->SetMarkerColor(6);
gr3->SetMarkerStyle(23);
gr3->Draw();
TMultiGraph *mg = new TMultiGraph();
mg->Add(gr);
mg->Add(gr1);
mg->Add(gr2);
mg->Add(gr3);
mg-> GetXaxis()->SetTitle("alpha");
mg-> GetYaxis()->SetTitle("Cross Section");
gPad->Modified();
mg->GetXaxis()->SetLimits(0,0.120);
mg->SetMinimum(0.);
mg->SetMaximum(15.);
mg->Draw("ALP");
auto *leg = new TLegend(0.2, 0.2, 0.5, 0.4);
leg->SetHeader("Inner bars= as outer Bar=Pdf +as","P");
leg->AddEntry(gr,"CT10","P");
leg->AddEntry(gr2,"CT14","P");
leg->Draw();
{
   TCanvas *c1 = new TCanvas("c1","c1",600,400);
   TGraphErrors *gr =new TGraphErrors();
   gr->SetTitle("Graph");
   gr-> GetXaxis()->SetTitle("alpha");
   gr-> GetYaxis()->SetTitle("Cross Section");
   double x , y , ex ,ey;
   int n = 0 ;
   n= gr->GetN();//take actual nbr of data file
   gr->SetPoint(n,0.118001,10.07);//for defining the point
   gr->SetPointError(n ,0.001 ,1.53);
   gr->SetLineColor(2);
   gr->SetMarkerColor(6);
   gr->SetMarkerStyle(22);
   gr->Draw();
   TGraphErrors *gr1 =new TGraphErrors();
   double x1 , y1 , ex1 ,ey1;
   int m = 0 ;
   m= gr1->GetN();//take actual nbr of data file
   gr1->SetPoint(m,0.118001,10.07);//for defining the point
   gr1->SetPointError(n ,0.0 ,1.71);
   gr1->SetLineColor(2);
   gr1->SetMarkerColor(6);
   gr1->SetMarkerStyle(22);
   gr1->Draw();
   TGraphErrors *gr2 =new TGraphErrors();
   double x12 , y12 , ex12 ,ey12;
   int p = 0 ;
   p= gr2->GetN();//take actual nbr of data file
   gr2->SetPoint(p,0.118,10.58);//for defining the point
   gr2->SetPointError(n ,0.002 ,1.15);
   gr2->SetLineColor(3);
   gr2->SetMarkerColor(6);
   gr2->SetMarkerStyle(23);
   gr2->Draw();
   TGraphErrors *gr3 =new TGraphErrors();
   double x122 , y122 , ex122 ,ey122;
   int q = 0 ;
   q= gr3->GetN();
   gr3->SetPoint(q,0.118,10.58);
   gr3->SetPointError(n ,0.0 ,1.34);
   gr3->SetLineColor(3);
   gr3->SetMarkerColor(6);
   gr3->SetMarkerStyle(23);
   gr3->Draw();
   TMultiGraph  *mg  = new TMultiGraph();
   mg->Add(gr);
   mg->Add(gr1);
   mg->Add(gr2);
   mg->Add(gr3);
   mg-> GetXaxis()->SetTitle("alpha");
   mg-> GetYaxis()->SetTitle("Cross Section");
   gPad->Modified();
   mg->GetXaxis()->SetLimits(0,0.120);
   mg->SetMinimum(0.);
   mg->SetMaximum(15.);


   mg->Draw("ALP");
   gPad->Update();
   mg->GetXaxis()->SetNdivisions(508);

   auto *leg = new TLegend(0.2, 0.2, 0.5, 0.4);
   leg->SetHeader("Inner bars= as outer Bar=Pdf +as","P");
   leg->AddEntry(gr,"CT10","P");
   leg->AddEntry(gr2,"CT14","P");
   leg->Draw();
}
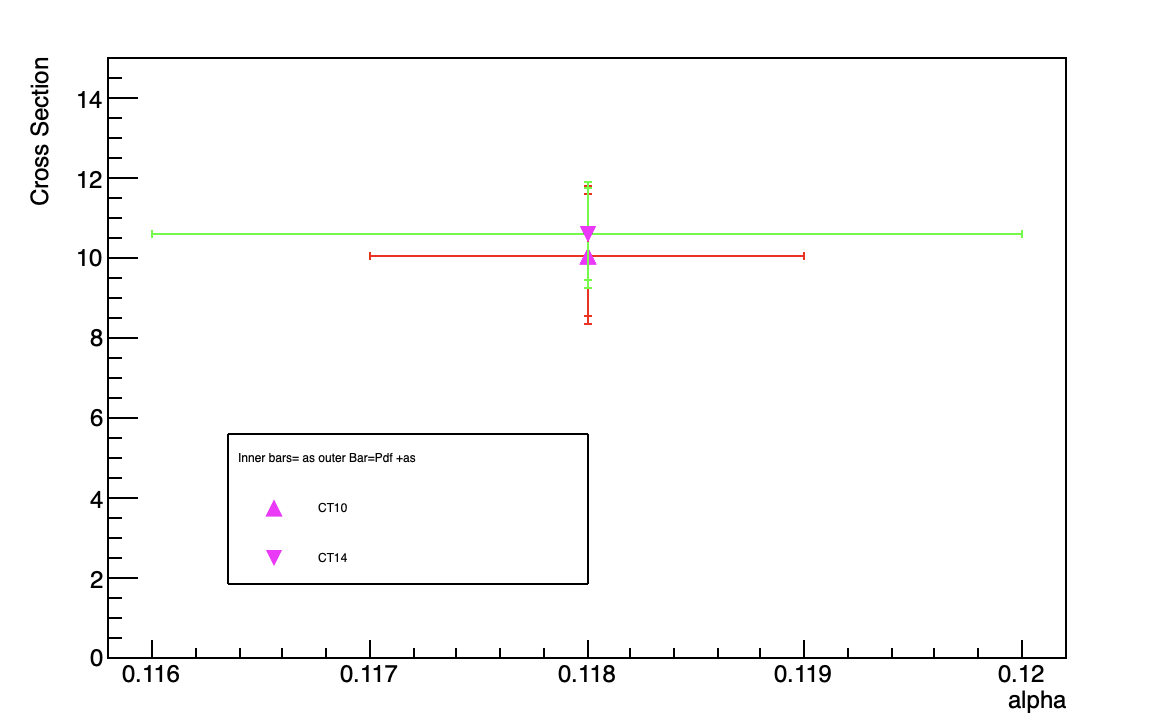
How to make a difference of 0.114-0.116
   mg->Draw("ALP");
   gPad->Update();
   mg->GetXaxis()->SetLimits(0.114, 0.120); // or, e.g., (0.1138, 0.1202)
Thanks
Two small comments:
- The upper limit at 0.12 is exactly the upper X value of the green error bars. Therefore it is hard to know if the error bar is clipped or not.
- The choice of markers is not the best. See ROOT: tutorials/graphics/markerwarning.C File Reference