I’m trying to plot 4 histos in one TCanvas. No problem with that. I divide it 2, 2 and plot the histos.
However I would like to set the margin between the pads in the canvas to 0 but there is always some space left in between (see picture1.gif).
I set everything to 0:
for the canvas and the pad - so commands like:
canv.SetLeftMargin(0.);
that there is still this gap does it have to do with the bordermode maybe?
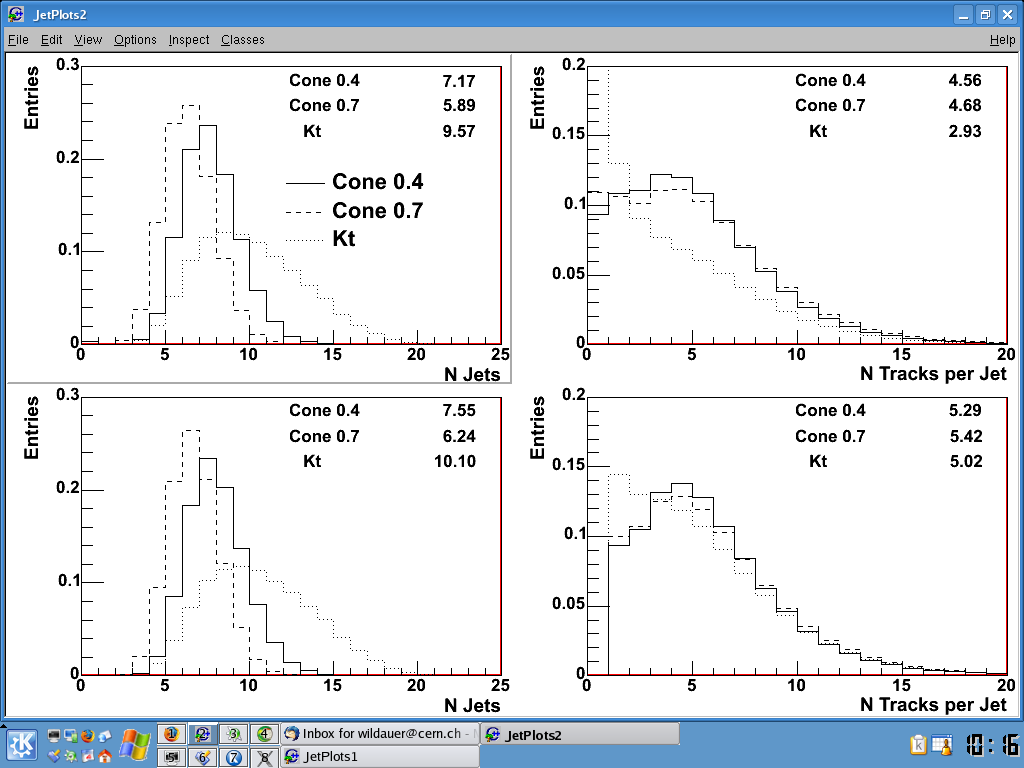
In picture2.gif you see that the label of the top histos is (senselessly) overlaped by the lower histos (with just white because of the margin I guess). But the top labels of the lower histos are also cut away … so there is something in between and I do not know how to get rid of it …
Hi Andi,
see example in tutorial zones.c (also in attachement)
Rene
// example of script showing how to divide a canvas
// into adjacent subpads + axis labels on the top and right side
// of the pads.
{
   gROOT->Reset();
   TCanvas c1("c1","multipads",900,700);
   gStyle->SetOptStat(0);
   c1.Divide(2,2,0,0);
   TH2F h1("h1","test1",10,0,1,20,0,20);
   TH2F h2("h2","test2",10,0,1,20,0,100);
   TH2F h3("h3","test3",10,0,1,20,-1,1);
   TH2F h4("h4","test4",10,0,1,20,0,1000);

   c1.cd(1);
   gPad->SetTickx(2);
   h1.Draw();

   c1.cd(2);
   gPad->SetTickx(2);
   gPad->SetTicky(2);
   h2.GetYaxis()->SetLabelOffset(0.01);
   h2.Draw();

   c1.cd(3);
   h3.Draw();

   c1.cd(4);
   gPad->SetTicky(2);
   h4.Draw();
}
Who is setting the axis color to red? The default in ROOT is black.
May be you are talking about the canvas borders. This could be
the canvas highlight color. You can set it to the same color as the canvas
via:
mycanvas.SetHighLightColor(19);// for exampleor
in your system.rootrc (or .rootrc)
If I set to to 19 then the fill color is grey but the right and lower borders/axis are not red anymore. If I set it to 0 then the right and lower borders are red again (and the fill color white as i want it).
Any other hint here?
Please be aware that not all borders are red. It is only the right and lower border/axis.
below is some code.
One thing which I found out now is that if I look at the produced eps file with some other program (like display blabla.eps) then the red border is gone … when I start the root exe however it is there (which does not bother me then so much if it is gone later - but still interesting).
Cheers
Andi
c1 = new TCanvas(“JetPlots1”, “JetPlots1”, 600, 300);
// normally in a method. replace canv. with c1->
canv.SetRightMargin(0.);
canv.SetLeftMargin(0.);
canv.SetTopMargin(0.);
canv.SetBottomMargin(0.);
canv.SetTicks(1,1);
canv.SetFillColor(0);
canv.SetHighLightColor(0);
What you see is the current pad highlighted.
As indicated in a previous mail, simply set the higlight color to the same colr as the pad/canvas, eg
c1->SetHighLightColor(19);
why should ALL pads be highlighted at the same time?
I attached a screen shot with the SetHighLightColor(19). The only difference to without is that the first pad (top left is highlighted) has an additional grey border (which is not there when I use my previous SetHighLightColor(0)).
The red thing is on all the pads at the same time.
Instead of the png file, could you send the canvas.root file
and also your rootlogon.C (if you have one) and you system.rootrc
in case you do not use the default settings?
I slimmed it down as much as I could and copied everything into:
~wildauer/public/root
I compile it with:
make MakePlots
and run with
./JetPlotMacro.exe
you should have to troubles reading the input file from castor (use stagepublic because the file is already staged on that one).
The style setting is done with methods from the SetGraphicsProperties file.
I dont think I have a rootlogon.C file.
The JetPlots1 root is also there (though I am not so sure what you meant with canvas.root file … I just did Save->*.root in the window of the plot.
Thanks for having a look
I guess it is just me using some wrong default settings here.
cheers
Andi
P.S.: this files are part of some other analysis code I wrote so please dont wonder if you encounter unused variables or similar
I see that you have the Frame line color and fill color set to 0.
We will investigate why this produces a red line.
As a quick workaround, I suggest to set the frame linewidth to 2 instead of 1.
gStyle->SetFrameLineWidth(2);
In fact we have a parameter to control the border mode. It can have 3 values: “Sunken”, “No Border” and “Raised”. What you want is “no border”. Just Do: