// Reads the points from a txt file and produces a simple comparison graph.
void read_graph_txt_AMPT_data()
{
   auto c=new TCanvas();
   c->SetGridy();
   c->SetLogy();

   TGraphErrors graph1("./data.txt","%lg %lg %lg 0");     // * means not select this column of data
   TGraphErrors graph2("./ALICE.txt","%lg %lg %lg 0");     // * means not select this column of data

   graph1.SetMarkerStyle(20);
   graph1.SetMarkerColor(kBlue);

   graph2.SetMarkerStyle(20);
   graph2.SetMarkerColor(kRed);

   TMultiGraph mg;
   mg.Add(&graph1);
   mg.Add(&graph2);
   mg.GetXaxis()->SetTitle("p_{T}(GeV)");
   mg.GetYaxis()->SetTitle("dN/dp_{T}(GeV^{2})");
   mg.GetXaxis()->CenterTitle();
   mg.GetYaxis()->CenterTitle();

   mg.DrawClone("ALP");
}
Did you try to run the .C macro I sent you ?
Yes, if that simple macro does not work for you, it might be an issue with the ROOT version. By the way on which operating system are you working ?
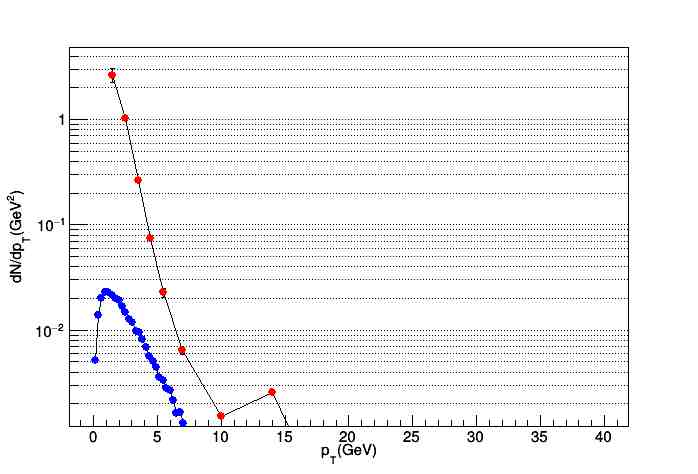
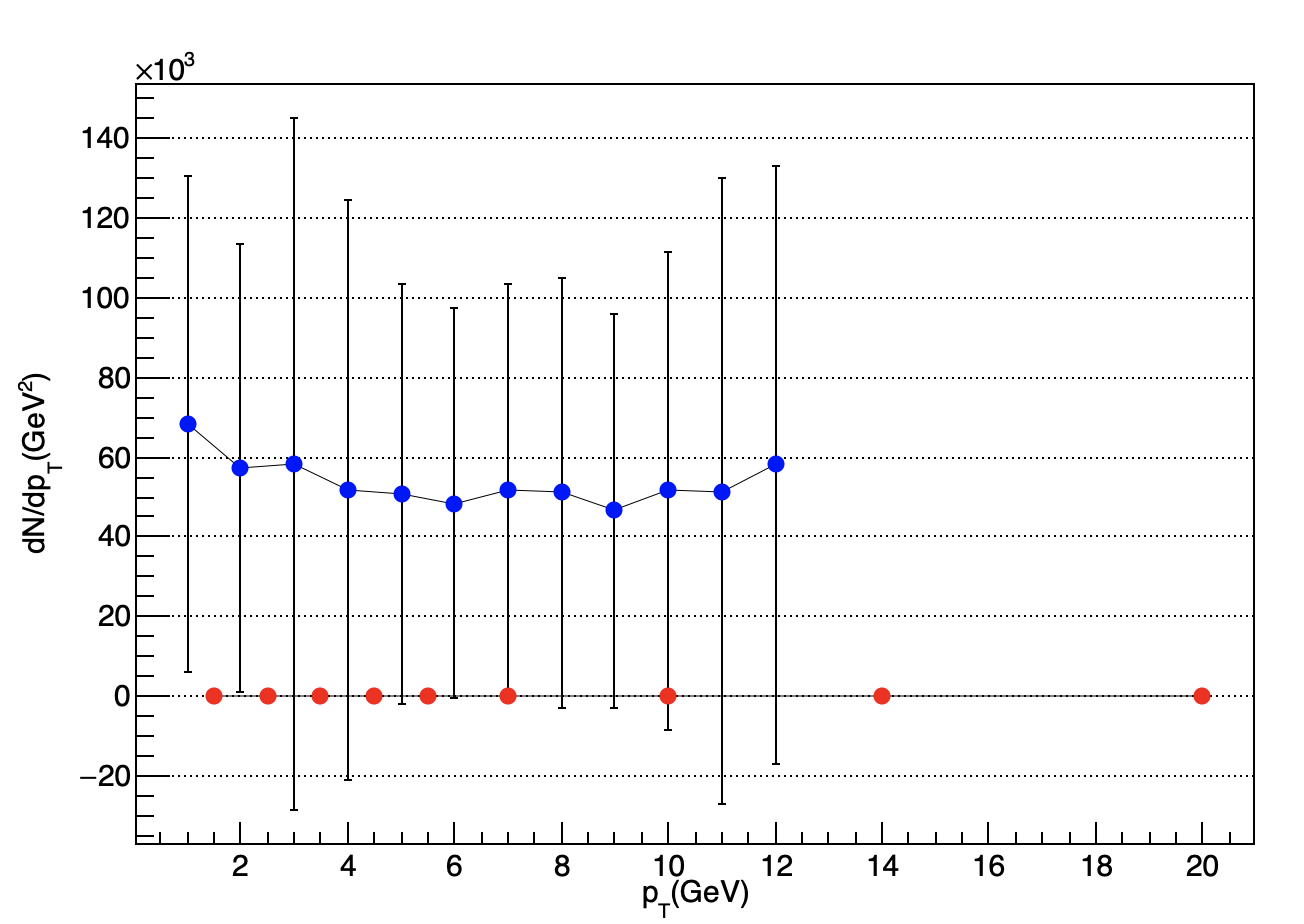
By the way, if I do not set the log scale in the macro I sent you, I get the following plot. Do you get the same in linear scale ?
% root
------------------------------------------------------------------
| Welcome to ROOT 6.24/07 https://root.cern |
| (c) 1995-2021, The ROOT Team; conception: R. Brun, F. Rademakers |
| Built for macosx64 on Jan 13 2022, 13:46:14 |
| From heads/v6-24-00-patches@v6-24-06-16-g3b59acd110 |
| With Apple clang version 12.0.5 (clang-1205.0.22.9) |
| Try '.help', '.demo', '.license', '.credits', '.quit'/'.q' |
------------------------------------------------------------------
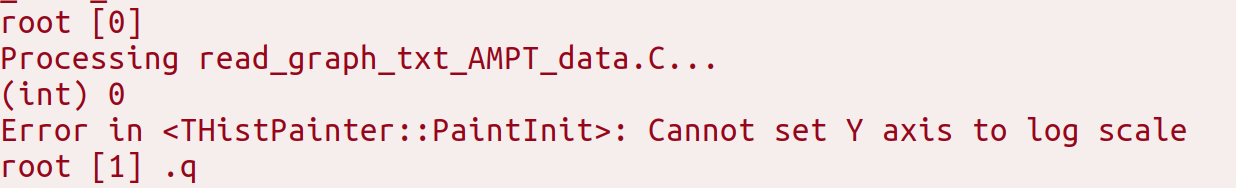
root [0] .x read_graph_txt_AMPT_data.C
Error in <THistPainter::PaintInit>: log scale requested with a negative argument (-0.151850)
root [1]
I guess 6.26 or master … For me it is working with master…
Thank you so much @couet
Now log scale working very well.
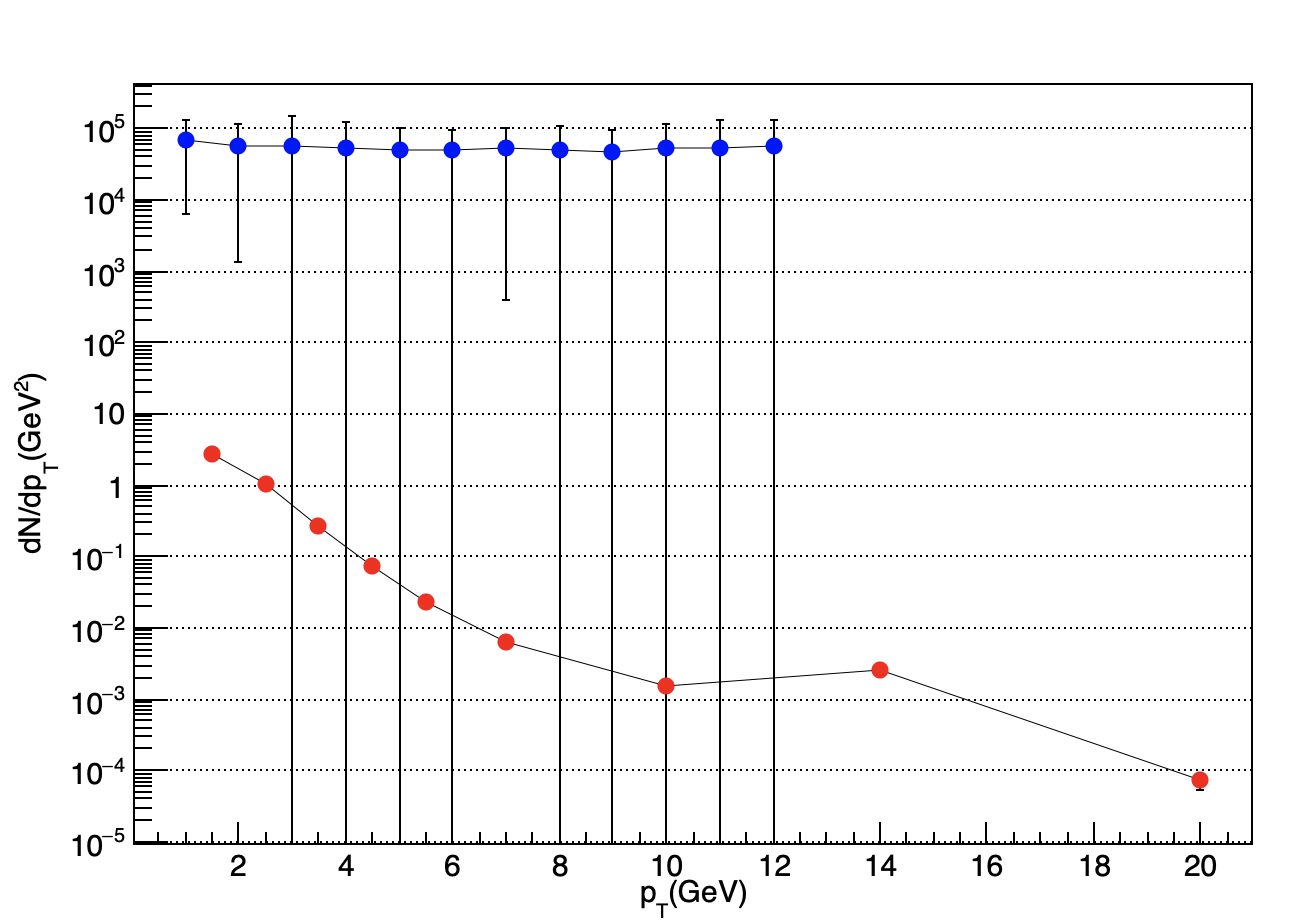
But when I am setting the Y-axis range in the .C macro script it is not accepting the range.
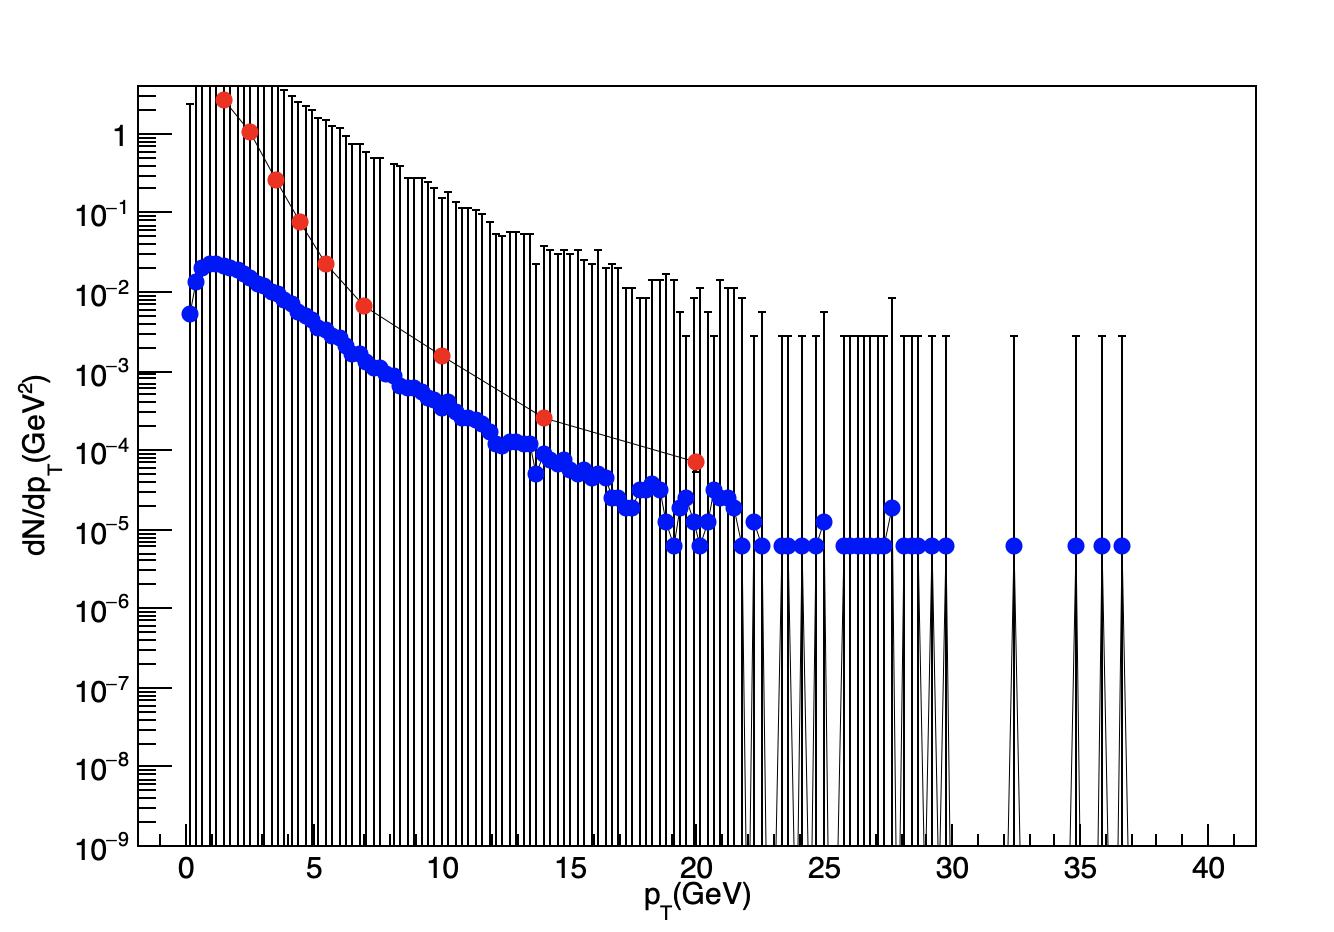
And another problem I am facing is that in the range of approx 20 - 40 GeV of X-axis pT range, it shows double or triangle type error bar(attached pdf).
I will be very thankful for your kind assistance if you have a look at this.
well, if you specify a valid positive range then you should remove SetMinimum()
// Reads the points from a txt file and produces a simple comparison graph.
void read_graph_txt_AMPT_data()
{
   auto c=new TCanvas();
   //c->SetGridy();
   c->SetLogy();

   TGraphErrors graph1("./data.txt","%lg %lg %lg 0");     // * means not select this column of data
   TGraphErrors graph2("./ALICE.txt","%lg %lg %lg 0");     // * means not select this column of data

   graph1.SetMarkerStyle(20);
   graph1.SetMarkerColor(kBlue);
   //graph1.GetYaxis()->SetRangeUser(10e-10, 4);

   graph2.SetMarkerStyle(20);
   graph2.SetMarkerColor(kRed);
   //graph2.GetYaxis()->SetRangeUser(10e-10, 4);

   TMultiGraph mg;
   mg.Add(&graph1);
   mg.Add(&graph2);
   mg.GetXaxis()->SetTitle("p_{T}(GeV)");
   mg.GetYaxis()->SetTitle("dN/dp_{T}(GeV^{2})");
   mg.GetXaxis()->CenterTitle();
   mg.GetYaxis()->CenterTitle();
   mg.GetYaxis()->SetRangeUser(10e-10, 4);
   mg.DrawClone("ALP");
}