But it seems that I have decimal values (as I multiply and divide with decimal numbers before plotting), I would like to round the values in the branches before plotting, how can I do it, I tried using Nint but it doesn’t work.
That is exactly what TMath::Nint does in the last command you posted. What should be an integer? axis value or the histogram content (the histogram content is also btw)?
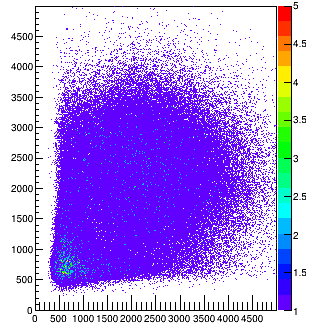
I see that in the color palette, I have values from 1 to 5 (from the figure), with decimal values, I want to have rounded values here ie., I want to round the histogram content.
The histogram h12 is filled with integer values because by default the weight of each “fill” is 1. The fact palette axis shows decimal values does not mean your histogram has decimal contents. It is only because the number of divisions for the Z axis is too large. Reduce it until you see integer values only.
Also, if your historgam has only 4 values on Z you might want to have a palette with 4 colors only.
I tried to reduce the Z axis but still I dont get integer values, also I made a palette with 4 colours.
I am attaching the root file here with.
[try.root|attachment] nez.root (1.8 MB)