Hi !
I’ve dealt with a 3D histogram for a while. Thanks to the ROOTers, I have a 3D plot like this:
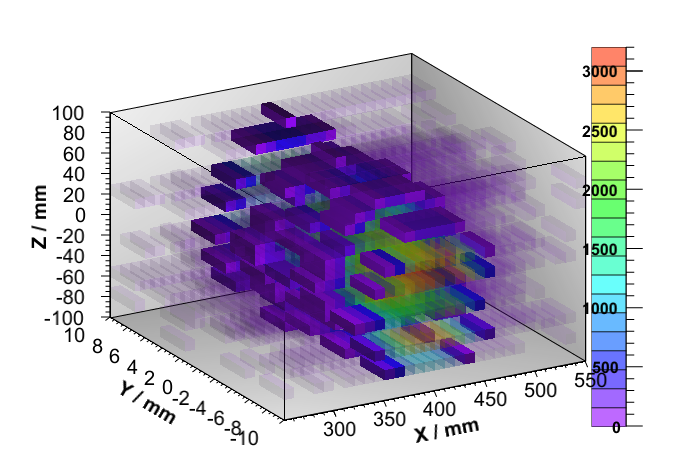
It looks good but I have two questions about it.
-
Can I keep the 12 lines of the frame and remove the faces?
-
The color palette looks different from the one generated with option “colz”. Can I change the color palette to the latter, generated with “colz”?