ROOT Version: v6-28-04@v6-28-04
Platform: macosxarm64
Compiler: Apple clang version 14.0.3 (clang-1403.0.22.14.1)
Hi, I’m trying to draw two TGraph2Ds on a TCanvas with a cylinder and sphere overlayed onto them so that the entire display can be rotated and the points on the graph can be seen. I have all of this working except for a couple of issues:
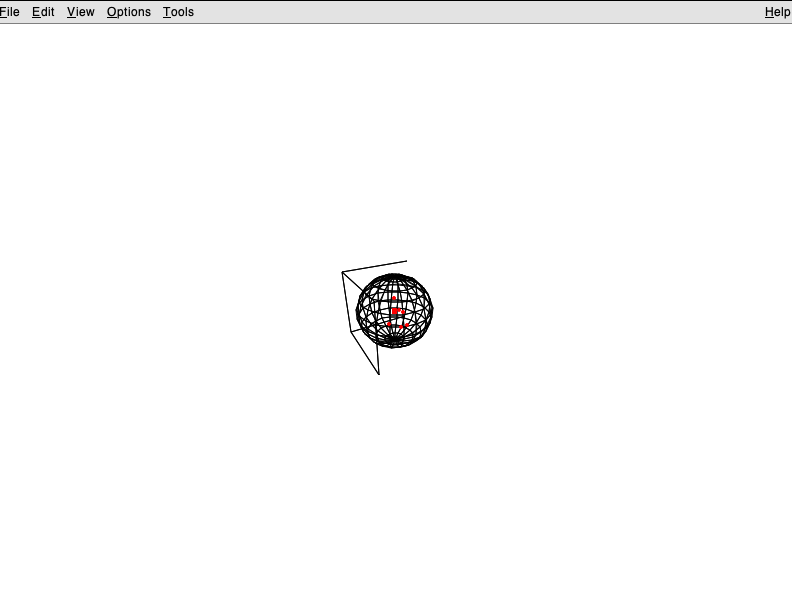
- The canvas initially draws with the view very zoomed out:
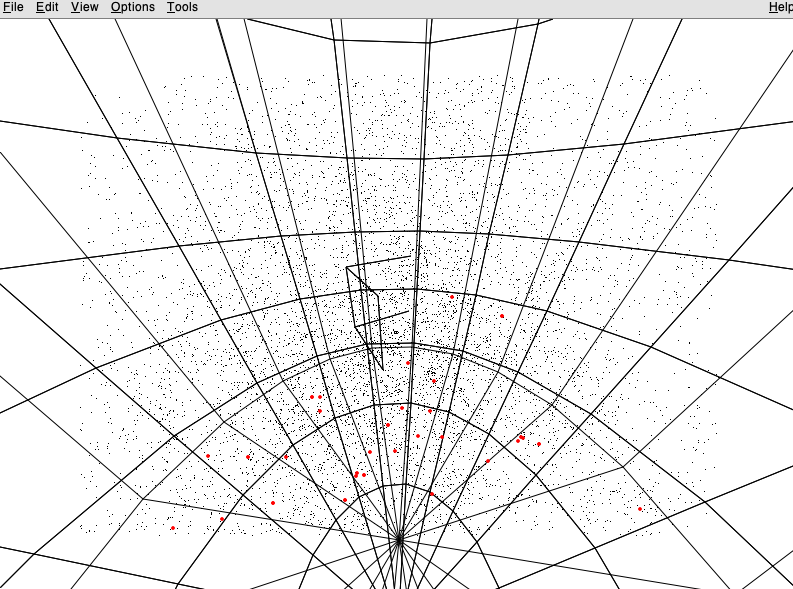
- When zooming in using A/S there is a set of ‘axes’ visible that I can’t seem to get rid of:
These axes appear to be related to theTViewobject that is created when drawing the sphere. If I draw a sphere by itself I don’t see any axes, same with a lone cylinder. When I add theTGraph2Ds using the"SAME"option then the axes appear.
How would I get rid of these?
Thanks,
Jack
Here is my code:
void plot3D() {
    // Open the data file
    std::ifstream infile("<SOME FILE NAME HERE>");

    if (!infile.is_open()) {
        std::cerr << "Unable to open file" << std::endl;
        return;
    }

    // Prepare the 3D graphs
    TGraph2D *graphInside = new TGraph2D();
    TGraph2D *graphOutside = new TGraph2D();
    graphInside->SetTitle("3D Cylinder Plot (Inside Cylinder);X (mm);Y (mm);Z (mm)");
    graphOutside->SetTitle("3D Cylinder Plot (Outside Cylinder);X (mm);Y (mm);Z (mm)");

    std::string line;
    int lineNumber = 0;

    // Read the file line by line
    while (std::getline(infile, line)) {
          // READ FILE AND ADD POINTS TO GRAPHS
    }

    infile.close();

    // Draw the graph
    TCanvas *canvas = new TCanvas("canvas", "3D Cylinder Plot", 800, 600);

    // Draw a large sphere
    TGeoSphere *mySphere = new TGeoSphere(1990, 2000., 0, 180, 0, 360);
    mySphere->Draw();

    // Draw a cylinder of some size on the same pad
    TGeoTube *myCyl = new TGeoTube(0., 35.5, 34.);
    myCyl->Draw("SAME");

    // Draw the points inside the cylinder
    graphInside->SetMarkerStyle(1); // Set marker style to dots
    graphInside->Draw("AIP SAME");    // Draw points on the same canvas

    // Draw the points outside the cylinder
    graphOutside->SetMarkerStyle(20);   // Set marker style to squares for outside points
    graphOutside->SetMarkerColor(kRed); // Set marker color to red for outside points
    graphOutside->SetMarkerSize(0.3);   // Increase marker size for outside points
    graphOutside->Draw("AIP SAME");       // Draw points on the same canvas

    canvas->Modified();
    canvas->Update();
}