I would like to redefine the started X and Y value for a defined object, because I want to dynamic allocate the started X and Y in a loop. I have no idea about achieving it.
The following is a simplified codes, both the new and old setting are shown in one plot.
TH2Poly *hc = new TH2Poly();
hc->SetTitle(“Honeycomb example”);
hc->Honeycomb(0,0,1,40,40);
hc->Clear();
hc->Honeycomb(-5,-5,1,40,40);
Could you please give me some advice?
Thank you very much.
Thank you for reply.
The following figure is plot from the code I mentioned, the red frame is given by the first range of X, Y start axis, the green frame is given by the second range of X, Y start axis. I would like to clean the first frame while I change the X, Y start axis.
I am not sure whether the plot can be update while the axis of X, Y is changed, because I want to allocate changed axis of X, Y in a loop to save computer resource.
What do you mean exactly by that ? “erase” the first frame ? it all depends how you produced this plot. Can you provide a small example reproducing what you are doing ? that will help to understand what you are trying to do.
Sorry for confusion, the attachment is the code.
In the loop, I would like to change point “hc” as the start axis of X and Y is changed, however,
the axis of filling content is not changed means the “hc” is the same.
Could you please help me to check it? Thank you very much. liubianxing1.C (1.1 KB)
Dear couet,
Thank you for reply.
The output means the bin of the filling point is not changed with the “hc” ( that is to say the start X and Y are the same for the “hc” ), the expected output are
-0.1 -0.1
20 24
-0.095 -0.1
19 24
-0.09 -0.1
18 24
-0.085 -0.1
17 24
-0.08 -0.1
16 24
-0.075 -0.1
15 24
-0.07 -0.1
14 24
-0.065 -0.1
13 24
-0.06 -0.1
12 24
-0.055 -0.1
11 24
I have difficulties to understand your code. The Honeycomb method is designed to define TH2Poly bins as a regular grid in a honeycomb structure and is typically intended to be used once during the creation of the TH2Poly. However, in your code, you use a loop with 10 iterations, modifying the TH2Poly binning in each iteration. What is the purpose of such a loop? It doesn’t seem to make much sense to me.
Dear couet,
Thanks for explanation, now I could understand based on your illustration.
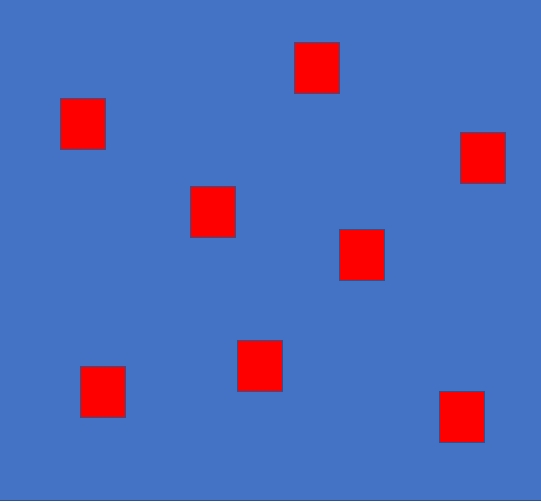
Actually, I expected to create a relative big grid as shown on the figure,
the blue region is grid 500500, the red region is the potential interested gird with 4040, the red region is random for each loop. Surely, we can create a blue region and clear the bin content in each loop, but the calculation is slow due to the big grid filled each time. Therefore, I try to create a dynamic red region by changing the start axis of X and Y.
Okay, I believe your honeycomb should be the large 500x500 grid (but keep in mind that 500x500 is quite large and could consume a lot of memory). You define it once and you fill in the red parts (if I understand correctly what you’re trying to do).
By the way, why do you need a honeycomb for this? Wouldn’t a regular 2D histogram suffice?