How to read multiple txt files in a code

hello, I have 5 txt file, I want to plots with Histogram option “HIST L” to the same Canvas, I tried to draw one after the other and when I do “same” in one Canvas with TBrowser I do not succeed to make two curve with option “HIST L” always it keeps the last curve with this option. so I want to try to trace them in the same code, can anyone help me?
image

this the code i used :

#include "Riostream.h"
void rt1()

{
   TString dir = gSystem->UnixPathName(__FILE__);
   dir.ReplaceAll("rt1.C","");
   dir.ReplaceAll("/./","/");
   ifstream in;
   in.open(Form("%sNi.txt",dir.Data()));
   Float_t x,y;
   Int_t nlines = 0;
   TFile *f = new TFile("profile.root","RECREATE");
   TCanvas *c1 = new TCanvas("c1","c1",600,400);
   TH1F *he = new TH1F("he"," with Histogram ",100,-150,150);
   
  while (1) {
      in >> x >> y;
      if (!in.good()) break;
      if (nlines < 800000) printf("x=%8f, y=%8f\n",x,y);
 nlines++;     
 he->Fill(x,y);     
   }
gStyle->SetEndErrorSize(3);
gStyle->SetErrorX(1.);
he->SetMarkerStyle(20);
he->SetMarkerStyle(2);
he->SetMarkerColor(kBlue);
  he->Draw("HIST L");
//ReverseYAxis(he);
f->Write();
   return c1;
}

ROOT Version: Not Provided
Platform: Not Provided
Compiler: Not Provided


Hi,

I am afraid I do not understand :frowning: What is the problem?

Cheers,
D

1 Like

thank you for your answer,
I want to plot 5 txt file with a code?

Hi,

if they are organised in a tabular form, as I understand yours are, you can merge them and use RDataFrame.

Cheers,
D

1 Like

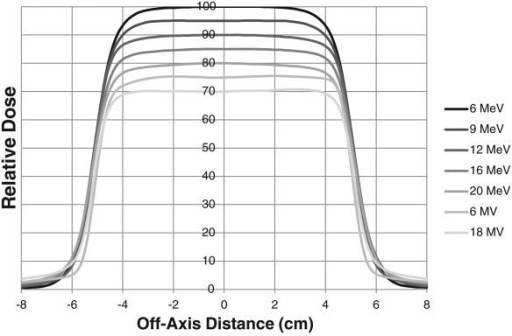
no, each file corresponding an energy, I want to plot them in a Canvas, the code above to trace from a one file.txt, so my question is how to read these files in same code to trace them like that:
image

Hi,

it looks like you need to create a TGraph from a data frame as shown in the example above and then draw them together with the “Same” option specified.
We can tackle this in steps. Are you able to produce 5 graphs from the txt files?
D

1 Like

To make sure the scales along the x and y axis will automatically contain all the TGraphs you will get from RDataFrame, you can also group them in a TMultiGraph and draw it (one single Draw).

1 Like

I want to draw them by the histogram, Tgraph does not give me good curves.

hello I tried to plot two Histogram with read two text files, but this code gives nothing ! someone can me help

int mult(){
   THStack hs("hs","test stacked histograms");
 TCanvas *c1 = new TCanvas("c1","c1",600,400);
//------------------------------------------------------------- 
   ifstream in;
   in.open(Form("prNi.txt"));
   Float_t x,y;
    TH1F *he1 = new TH1F("he"," with Histogram ",100,-150,150);
   Int_t nlines = 0;
  while (1) {
      in >> x >> y;
      if (!in.good()) break;
      if (nlines < 800000)
 nlines++;     
 he1->Fill(x,y);     
   }
  he1->SetFillColor(kYellow);
   he1->DrawClone("HIST L"); 
//----------------------------------------------------------------
   ifstream inp;
   inp.open(Form("prAl.txt"));
   Float_t e,r;
   Int_t nline = 0;
     TH1F *he2 = new TH1F("he"," with Histogram ",100,-150,150);
  while (1) {
      in >> e >> r;
      if (!inp.good()) break;
      if (nline < 800000) 
 nline++;     
 he2->Fill(e,r);     
   }
   hs.Draw("nostack");
}

Can you provide the txt files ? so we can run your script ?

ok, the files are very big their size exceeds 40MB, I tried to create these files to test this code.
try to change:

  TH1F * he = new TH1F ("he", "with Histogram", 20, -50.50)

test1.txt (707 Bytes)
test2.txt (688 Bytes)

Many mistakes in your macro…
Here is a working version:

void mult(){
   auto hs = new THStack("hs","test stacked histograms");

   ifstream in;
   in.open(Form("test1.txt"));
   Float_t x,y;
   TH1F *he1 = new TH1F("he1"," with Histogram ",100,-150,150);

   while (1) {
      in >> x >> y;
      if (!in.good()) break;
      he1->Fill(x,y);
   }

   he1->SetFillColor(kYellow);
   hs->Add(he1,"hist");

   ifstream inp;
   inp.open(Form("test2.txt"));
   Float_t e,r;

   TH1F *he2 = new TH1F("he2"," with Histogram ",100,-150,150);
   while (1) {
      inp >> e >> r;
      if (!inp.good()) break;
      he2->Fill(e,r);
   }
   he2->SetFillColor(kRed);
   hs->Add(he2, "hist");

   hs->Draw("nostack");
}

thank you very much, this code works well
image

This topic was automatically closed 14 days after the last reply. New replies are no longer allowed.