_
Dear team,
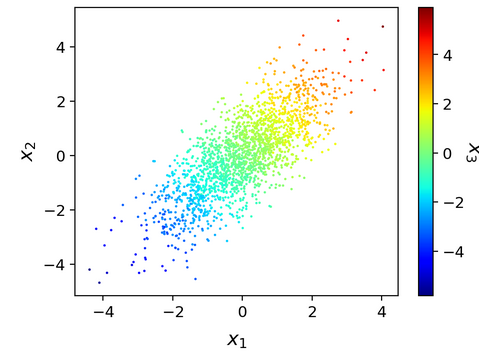
I want a plot where two variables are plotted on the X and Y axis whereas the third variable can be plotted on the Z axis. An example plot is attached here. Can I get a graph like this?
Thanks and regards,
Arpita Mondal
_
Dear team,
I want a plot where two variables are plotted on the X and Y axis whereas the third variable can be plotted on the Z axis. An example plot is attached here. Can I get a graph like this?
Thanks and regards,
Arpita Mondal
If your data are stored in a 2D histogram h2 use:
h2->Draw("colz");
If your data are stored in array use TScatter.
Thank you for your response.
My data are stored in an array. So, I am trying to use TScatter. But I got an error like this
"error: unknown type name ‘TScatter’ "
What should I do?
Thanks and regards,
Arpita
We can use TScatter for version 6.30. But I have Root version-6.22.
Is there any easy way to update my Root version from 6.22 to 6.30?
I need to complete the plot. So if you can help me it will be great.
Thanks and regards,
Arpita
Thanks for the help. I have installed root_v6.30.02 and I have got the desired plot.