How to plot with a linear and log scale on two different axes on same plot?

I am trying to figure out how to plot something on a linear axis and then plot another quantity on a log axis on the same plot and then have the two y-axes be on different scales as well. I’m currently attempting to do this with drawing the first histogram on a TPad and then drawing the second histogram on a transparent TPad above it. However, I am not sure how to get a log scale for the second histogram (the log scale is a property of the TCanvas I think, not a TPad) and then how to use TGaxis properly with the log scale and second histogram.

Any suggestions are very welcome.

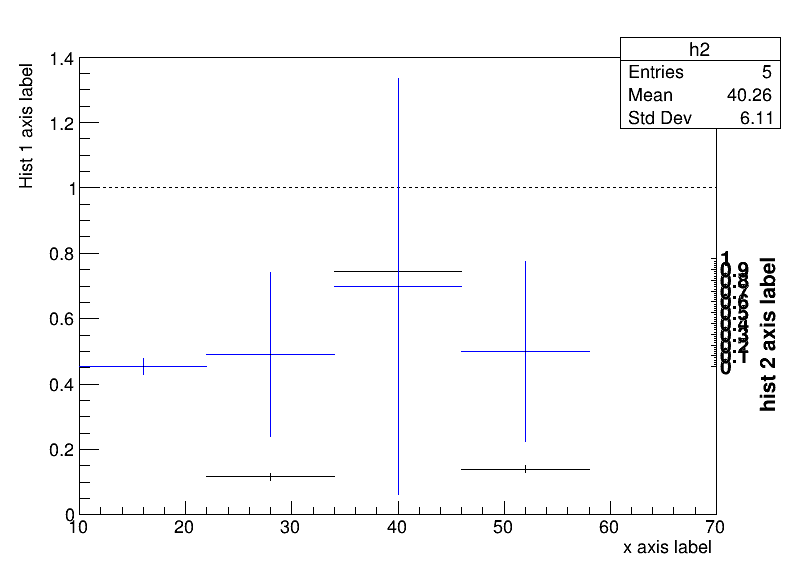
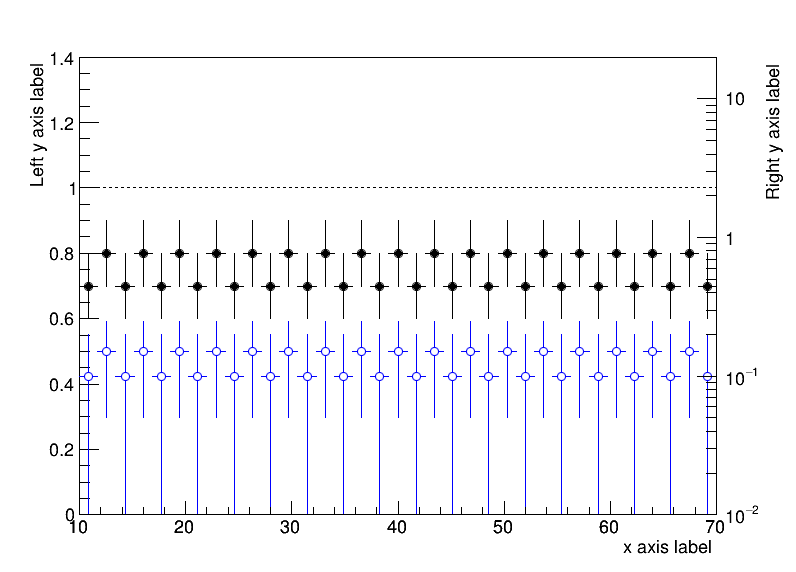
I’m attached an example RootPy script that mocks up a demo of something close to what I’m trying to do (linear_log_axes_test.py (1.7 KB)) and I’m running it on lxplus with

$ lsetup root
$ root-config --version
6.10/04

The script contents and output are below as well

import ROOT
ROOT.gROOT.SetBatch(True)  # Supress output to screen


def main():
    # Create the canvas
    can = ROOT.TCanvas('c', '', 800, 600)
    x_range = [10, 70]

    # Use a base pad and then a transparent pad
    base_pad = ROOT.TPad('base_pad', '', 0, 0, 1, 1)
    clear_pad = ROOT.TPad('clear_pad', '', 0, 0, 1, 1)
    clear_pad.SetFillColor(0)
    clear_pad.SetFillStyle(4000)
    clear_pad.SetFrameFillStyle(0)

    base_pad.Draw()
    base_pad.cd()

    # Turn off the tick marks on the right hand side y-axis
    base_pad.SetTicky(0)

    h1 = ROOT.TH1F('h1', '', 5, x_range[0], x_range[1])
    for itr in range(0, 1001):
        h1.Fill(ROOT.gRandom.Gaus(40, 5))
    h1.Scale(1 / h1.Integral())
    h1.SetLineColor(ROOT.kBlack)
    h1.GetYaxis().SetRangeUser(0, 1.4)
    h1.GetYaxis().SetTitle('Hist 1 axis label')
    h1.GetXaxis().SetTitle('x axis label')

    h1.Draw()

    # distiguish visually efficiency of 1
    eff_of_one_line = ROOT.TLine(x_range[0], 1.0, x_range[1], 1.0)
    eff_of_one_line.SetLineStyle(2)
    eff_of_one_line.Draw('SAME')

    clear_pad.Draw()
    clear_pad.cd()
    clear_pad.SetTicks(0, 0)

    # The pad should be on a log scale, but how?
    can.SetLogy(1)

    h2 = ROOT.TH1F('h2', '', 5, x_range[0], x_range[1])
    for bin in range(1, 6):
        h2.SetBinContent(bin, 0.2 * h1.GetBinContent(bin))
    h2.Scale(1 / h2.Integral())
    h2.SetLineColor(ROOT.kBlue)
    h2.Draw('A')

    log_axis_y_min = 0
    log_axis_y_max = 1
    log_axis = ROOT.TGaxis(70, 0, 70, 1, log_axis_y_min,
                           log_axis_y_max, 510, '+L')
    log_axis.SetTitle('hist 2 axis label')
    log_axis.Draw()

    can.SaveAs('linear_log_axes_test.pdf')


if __name__ == '__main__':
    main()

The log attribute belongs to the pad. So you can set log scale on a pad.

@couet correct. I have internal data in my real plot which is causing me to get a

Error in <THistPainter::PaintInit>: Cannot set Y axis to log scale

at the moment when I try to do the

clear_pad.SetLogy(1)

so I guess I need to debug that before I can go any farther with dealing with the TGaxis

You do not need TGAxis. You can plot a Pad with log scale on top of a Pad in linear scale.
Then the option X+ and/or Y+ will allow you to draw the axis on top or the right when you
draw the histogram is log scale.

1 Like

@couet That works great! Thanks!

The other problems I have are due to the ATLAS Style enforcement messing up the canvas. If I just use vanilla ROOT then I get what I wanted. Here is an example of what all I was trying to do: linear_log_axes_test.py (1.9 KB)

import ROOT
ROOT.gROOT.SetBatch(True)  # Supress output to screen


def main():

    ROOT.gStyle.SetOptStat(0)
    # Create the canvas
    can = ROOT.TCanvas('can', '', 800, 600)
    x_range = [10, 70]

    # Use a base pad (the canvas) and then a transparent pad
    clear_pad = ROOT.TPad('clear_pad', '', 0, 0, 1, 1)
    clear_pad.SetFillColor(0)
    clear_pad.SetFillStyle(4000)
    clear_pad.SetFrameFillStyle(0)

    # Turn off the tick marks on the right hand side y-axis
    can.SetTicky(0)

    h1 = ROOT.TH1F('h1', '', 35, x_range[0], x_range[1])
    h1.GetXaxis().SetTitle('x axis label')
    h1.GetYaxis().SetTitle('Left y axis label')
    h1.GetYaxis().SetRangeUser(1e-16, 1.4)
    h1.SetLineColor(ROOT.kBlack)
    h1.SetMarkerColor(ROOT.kBlack)
    h1.SetMarkerStyle(ROOT.kFullCircle)

    for i in range(h1.GetNbinsX() + 1):
        if i % 2 == 0:
            h1.SetBinContent(i, 0.8)
        else:
            h1.SetBinContent(i, 0.7)
        h1.SetBinError(i, 0.1)

    h1.Draw('')

    # distiguish visually efficiency of 1
    eff_of_one_line = ROOT.TLine(x_range[0], 1.0, x_range[1], 1.0)
    eff_of_one_line.SetLineStyle(2)
    eff_of_one_line.Draw('SAME')

    # Draw h2 information
    clear_pad.Draw()
    clear_pad.cd()
    clear_pad.SetTicks(0, 0)
    # h2 should be on a log scale
    clear_pad.SetLogy(1)

    h2 = ROOT.TH1F('h2', '', 35, x_range[0], x_range[1])
    h2.GetYaxis().SetTitle('Right y axis label')
    h2.GetYaxis().SetTitleOffset(1.3)
    h2_y_min = 1e-2
    h2_y_max = 20
    h2.GetYaxis().SetRangeUser(h2_y_min, h2_y_max)
    h2.SetLineColor(ROOT.kBlue)
    h2.SetMarkerColor(ROOT.kBlue)
    h2.SetMarkerStyle(ROOT.kOpenCircle)

    for i in range(h2.GetNbinsX() + 1):
        if i % 2 == 0:
            h2.SetBinContent(i, 0.15)
        else:
            h2.SetBinContent(i, 0.1)
        h2.SetBinError(i, 0.1)

    h2.Draw('Y+')

    can.SaveAs('linear_log_axes_test.pdf')


if __name__ == '__main__':
    main()

When i execute the script you posted I get the plot you posted also, which seems to me is correct … what should do to see the invalid plot ?

@couet You need to also do

ROOT.gROOT.LoadMacro('./your-path-to-goes-here/AtlasStyle.C')
ROOT.SetAtlasStyle()

at the top. Though I also ended up taking out the legend and watermarks that were getting pushed around and causing issues, so that alone might not cause issues.

Sorry but I do not have AtlasStyle.C

@couet That’s okay. This isn’t really a ROOT issue anymore. I can look into the bug on my own later and follow up with the necessary people in ATLAS. Thanks for all your help!

Ok, that’s good. Do not hesitate to come back in case of problem.

This topic was automatically closed 14 days after the last reply. New replies are no longer allowed.