Dear experts how to set custom x and y axes to plot multiple graphs?
basically, I want to plot something like this
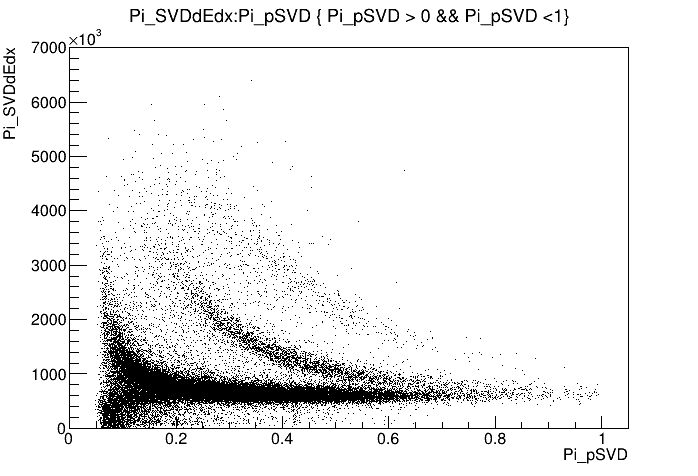
Lambda->Draw("Pi_SVDdEdx:Pi_pSVD", " Pi_pSVD > 0 && Pi_pSVD <1") "
but, two plots data and mc on same canvas.
thank you!
Irt seems you are drawing a TTree. You ask for Pi_SVDdE versus Pi_pSVD.
What is mc ?
I intend to plot Lambda->Draw("Pi_SVDdEdx:Pi_pSVD", " Pi_pSVD > 0 && Pi_pSVD <1") from data & montecarlo, basically two different root files on same canvas.
Do the 2nd plot with option SAME:
Lambda->Draw("Pi_SVDdEdx:Pi_pSVD", " Pi_pSVD > 0 && Pi_pSVD <1", "SAME")