How to plot two graph in one canvas from two separate root file, the key of the graph is canvas

Hello,
I want to plot two graph from two separate root files into one canvas. I am able to get one plot but I could not able to plot two in one canvas. The key of the plot in the root file is canvas.
I have attached my code here.
I would be very grateful if anyone helps me.
Thanks!
first.root (11.7 KB)
second.root (11.7 KB)

void readplot(){
TFile* f1 = new TFile("first.root","READ");
TFile* f2 = new TFile("second.root","READ");
TCanvas* h1;
TCanvas* h2;
f1->GetObject("c",h1);
f2->GetObject("c",h2);
h1->Draw();
//h1->SetLineColor(kRed); 
//h2->SetLineColor(kBlue);
h2->Draw("same"); 
} 

You access TCanvas. You cannot superimpose TCanavs like histograms.
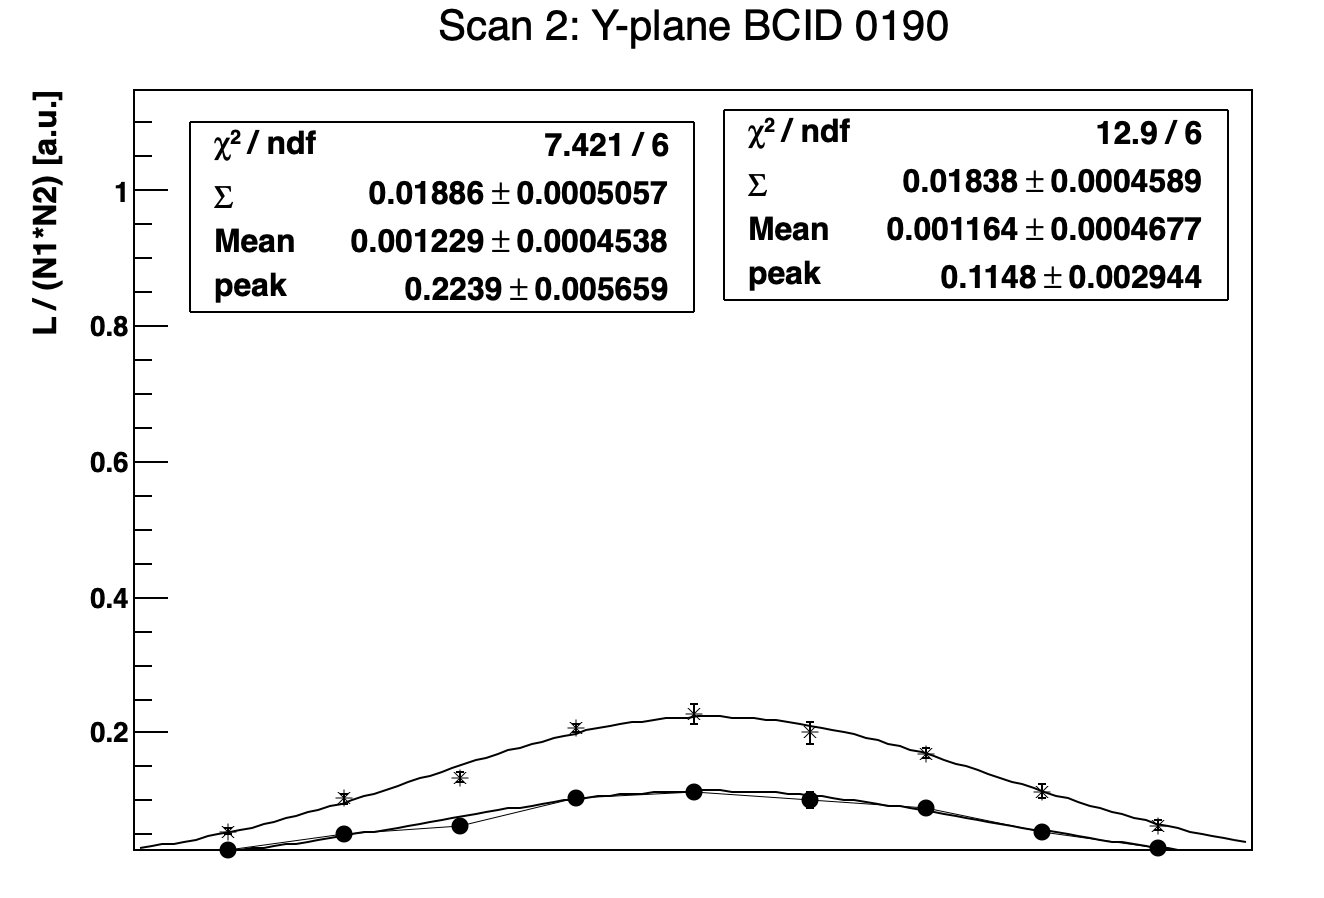
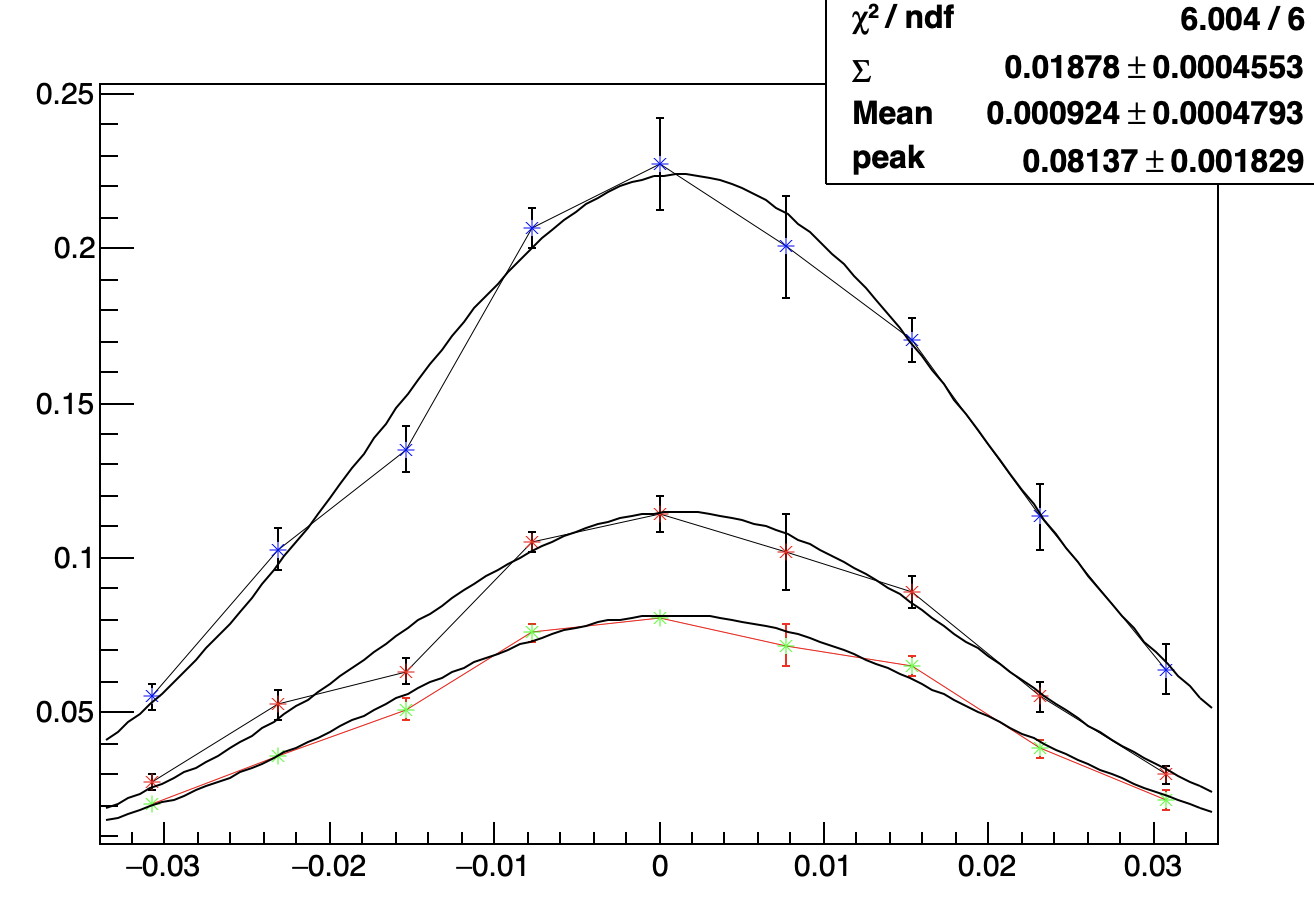
Moreover your canvases do not contain histograms they contains TGraphAsymmErrors
You can try to get them from the canvas with:

TGraphAsymmErrors *g1 = (TGraphAsymmErrors*)c1->GetListOfPrimitives()->FindObject(.......);

Hello,
Many thanks!
Now I updated my code:

void Test()
{

TFile *f1 = TFile::Open("first.root");
TCanvas *c1 = (TCanvas*)f1->Get("c");
TGraphErrors *g1 = (TGraphErrors*)c1->GetPrimitive("Graph");
g1->GetYaxis()->SetRangeUser(-3,3);
g1->GetXaxis()->SetLimits(-0.5,0.5);
c1->Draw();
c1->SetGridy(0);
c1->SetGridx(0);

TFile *f2 = TFile::Open("second.root");
TCanvas *c2 = (TCanvas*)f2->Get("c");
TGraphErrors *g2 = (TGraphErrors*)c2->GetPrimitive("Graph");
g2->GetYaxis()->SetRangeUser(-3,3);
g2->GetXaxis()->SetLimits(-0.5,0.5);
c2->Draw();
c2->SetGridy(0);
c2->SetGridx(0);
}

Now I am getting error like

warning: null passed to a callee that requires a non-null argument [-Wnonnull]
g1->GetYaxis()->SetRangeUser(-3,3);

I am not sure what should I fill the rang. Could you please help me to fix this?

You should not stored the canvases. You should store the TGraphs. Storing the canvases is not practical at all !
Any way with these two files you can do some tricks… but that’s really not straight forward:

void readplot(){
   TFile *f1 = TFile::Open("first.root");
   TCanvas *c1 = (TCanvas*)f1->Get("c");
   TPad *p1 = (TPad*)c1->GetPrimitive("p2");
   TGraphAsymmErrors *g1 = (TGraphAsymmErrors*)p1->GetPrimitive("2_Y_0190");

   TFile *f2 = TFile::Open("second.root");
   TCanvas *c2 = (TCanvas*)f2->Get("c");
   TPad *p2 = (TPad*)c2->GetPrimitive("p2");
   TGraphAsymmErrors *g2 = (TGraphAsymmErrors*)p2->GetPrimitive("2_Y_0190");

   auto C = new TCanvas();
   g1->Draw();
   g2->Draw("*");
}

Hello,
Using this script, I am not able to show the X axis range. Could you please give some suggestions that how can I show the X axis range also?

Lumi.C (1.4 KB)

I cannot run your macro.

Processing Lumi.C...
Error in <TFile::TFile>: file /Users/couet/Downloads/2_Y_0190_PLT.root does not exist
Error in <HandleInterpreterException>: Trying to dereference null pointer or trying to call routine taking non-null arguments
Execution of your code was aborted.
In file included from input_line_9:1:
/Users/couet/Downloads/Lumi.C:4:28: warning: null passed to a callee that requires a non-null argument [-Wnonnull]
   TCanvas *c1 = (TCanvas*)f1->Get("c");
                           ^~

I ran using the below command.

root -l Lumi.C
It is producing the plots. I have attached
first.root (11.7 KB)
second.root (11.7 KB)
here the root file also.
2_Y_0190_BCM1FPCVD.root (11.7 KB)

Here is the updated script.
Lumi.C (1.3 KB)

Still does not work:

root [0] 
Processing Lumi.C...
Error in <TFile::TFile>: file /Users/couet/Downloads/2_Y_0190_PLT.root does not exist
Error in <HandleInterpreterException>: Trying to dereference null pointer or trying to call routine taking non-null arguments
Execution of your code was aborted.
In file included from input_line_9:1:
/Users/couet/Downloads/Lumi.C:4:28: warning: null passed to a callee that requires a non-null argument [-Wnonnull]
   TCanvas *c1 = (TCanvas*)f1->Get("c");
                           ^~

Here is the updated script and root files
second.root (11.7 KB)
2_Y_0190_BCM1FPCVD.root (11.7 KB)
Lumi.C (1.3 KB)

first.root (11.7 KB)

It should work now.

Many Thanks!!

void Lumi(){

   TFile *f1 = TFile::Open("first.root");
   TCanvas *c1 = (TCanvas*)f1->Get("c");
   TPad *p1 = (TPad*)c1->GetPrimitive("p2");
   TGraphAsymmErrors *g1 = (TGraphAsymmErrors*)p1->GetPrimitive("2_Y_0190");
   g1->SetMarkerStyle(kCircle);
   g1->SetTitle("Y Plane scan, BCID 190//2017 XeXe,5.44 TeV");
   g1->SetMarkerColor(kRed);

   TFile *f2 = TFile::Open("second.root");
   TCanvas *c2 = (TCanvas*)f2->Get("c");
   TPad *p2 = (TPad*)c2->GetPrimitive("p2");
   TGraphAsymmErrors *g2 = (TGraphAsymmErrors*)p2->GetPrimitive("2_Y_0190");
   g2->SetMarkerStyle(kOpenSquare);
   g2->SetTitle("CMS Preliminary");
   g2->SetMarkerColor(kBlue);

   TFile *f3 = TFile::Open("2_Y_0190_BCM1FPCVD.root");
   TCanvas *c3 = (TCanvas*)f3->Get("c");
   TPad *p3 = (TPad*)c3->GetPrimitive("p2");
   TGraphAsymmErrors *g3 = (TGraphAsymmErrors*)p3->GetPrimitive("2_Y_0190");
   g3->SetLineColor(2);
   g3->SetTitle("VdM Scan:Fill 6295");
   g3->SetMarkerStyle(kFullSquare);
   g3->SetMarkerColor(kGreen);

   auto C = new TCanvas();
   auto mg  = new TMultiGraph();
   mg->Add(g1);
   mg->Add(g2);
   mg->Add(g3);
   mg->Draw("AL*");
}

Thanks so much!!!

You’re welcome. But it would be much better to store directly the TGraphs instead of the TCanvas and the TPad, The way you proceed is really not practical.

Sorry! I will keep in mind next time.
Thank you!