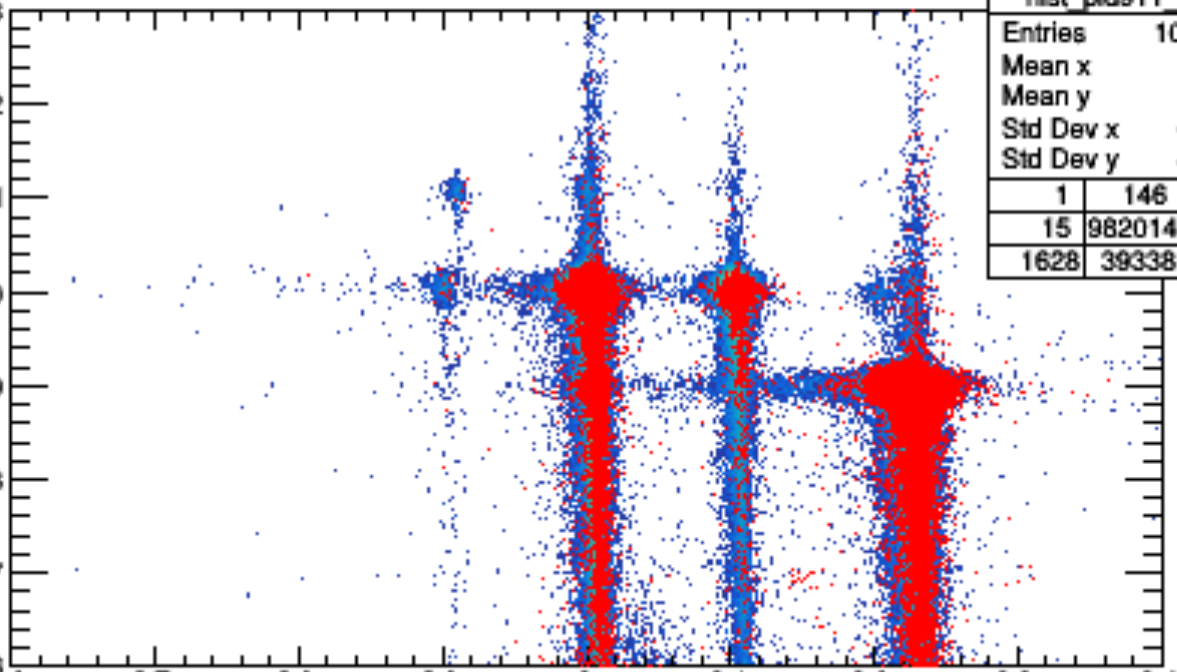
I saw the attached 2D histogram in one report. As you can notice, there are two 2D histograms on the same canvas, one with colour code and other with red colour. I think this is a nice presentation to notice any difference.
I tried to search but couldn’t find any answer on how to create this kind of a plot. Any suggestions on how to do this would be a great help.
Be careful that le default plotting option for 2D histograms is a “pseudo scatter plot”. I would not recommend it. Instead use the “box” option I pointed. Look at the “same” option used with “box”. It is much better in your case.