How to plot the X and Y axis projection on a 3D plot

Hi,

I am plotting a 3D plot (mass-energy spectrum with 2D fitting):

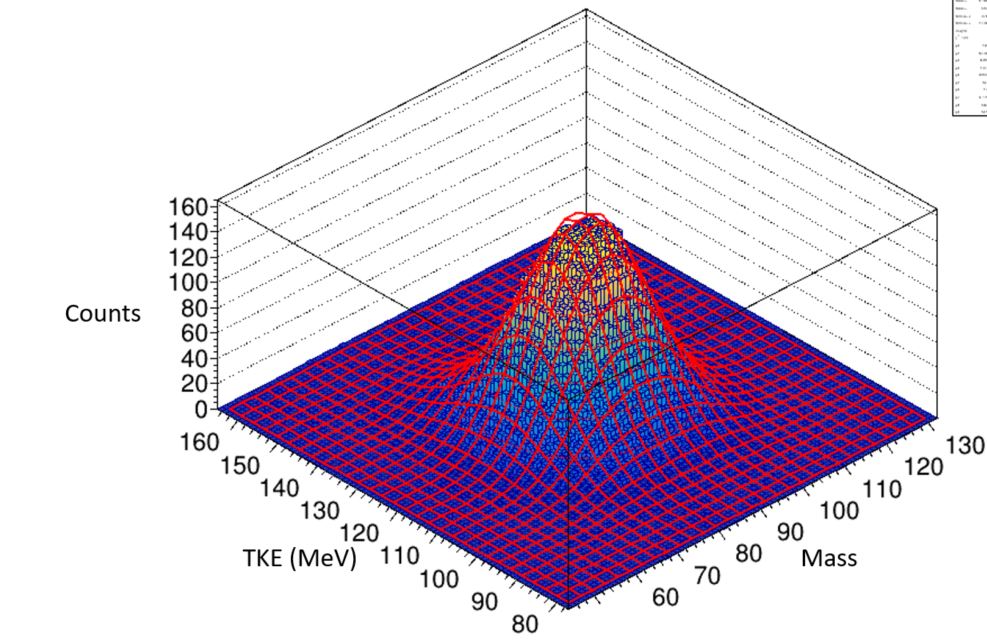
In the plot I would like to plot the projection of the TKE axis as well as the mass axis to show the 1D spectrum (in the white space opposite to the corresponding axis ). How to plot the x (Mass) and y (TKE) projections on the 3D plot.

You need to divide your canvas in 4 part and draw the 1D historgam in the pads corresponding to the X and Y projections.

Are there any examples available, as of now I won’t see how to do this…

https://root.cern/doc/master/h2proj_8C.html

Hi, Thanks for sharing the example.

To show a schematic representation of how I want to plot the x and y projection, please see the image :

Unfortunately I can’t place my pads, that too tilted on the lego 3D plot, is it possible to do it ?

Here I attach the macro and the 2D histogram I use :

Hist0new_158.root (8.3 KB)
myver_h2proj.C (777 Bytes)

thank you !

No, it is not, easily, possible. You can have cut planes with GL but that’s not what yu are looking for.

No its not what I am looking for. I think it my be possible with pyroot (uisng matplotlib, unfortunately I have never used it…) as shown below :

something like this…

@gini See your previous post again.
The 3-D plot has a vertical axis maximum of about 180.
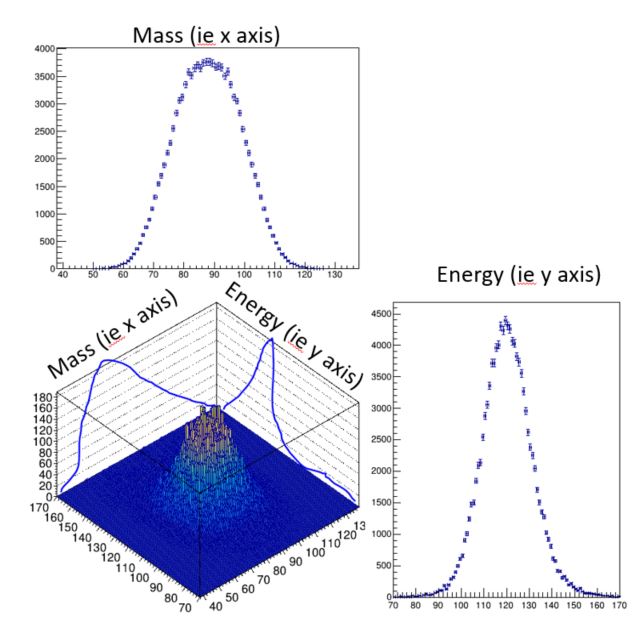
The “Mass (ie x axis)” and “Energy (ie y axis)” plots need vertical axis maximums of, respectively, 4000 and 4500 (i.e., they will not fit on the 3-D back-boxes).

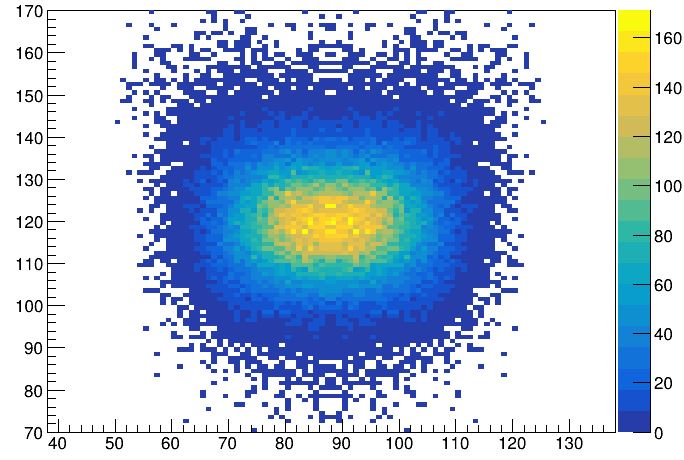
Yeah thats also a concern, so what I do is I plot my 2D histogram from my mass and tke branch (see plot1) and using TBrowser I plot my lego my 3D histogram (see plot 2) :

plot1

So if I understand things correctly then I need to normalise the x and Y projections before plotting it on the back boxes of my 3D histogram .