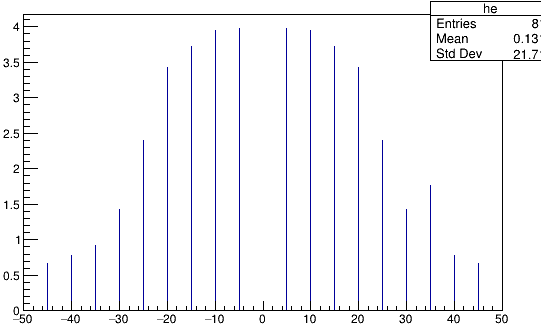
Hi, I tried to plot this .txt file (test.txt (661 Bytes)
) by this code in the root, I would like to connect the points by line, is possible in the root?
#include "Riostream.h"
void rt()
{
TString dir = gSystem->UnixPathName(__FILE__);
dir.ReplaceAll("rt.C","");
dir.ReplaceAll("/./","/");
ifstream in;
in.open(Form("%stest.txt",dir.Data()));
Float_t x,y;
Int_t nlines = 0;
TFile *f = new TFile("17wac.root","RECREATE");
TCanvas *c1 = new TCanvas("c1","c1",600,400);
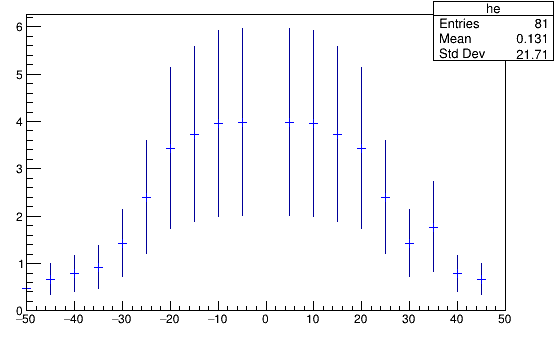
TH1F *he = new TH1F("he"," with Histogram ",100000,-50,50);
while (1) {
in >> x >> y;
if (!in.good()) break;
if (nlines < 800000) printf("x=%8f, y=%8f\n",x,y);
nlines++;
he->Fill(x,y);
}
gStyle->SetEndErrorSize(3);
gStyle->SetErrorX(1.);
he->SetMarkerStyle(20);
he->SetMarkerStyle(2);
he->SetMarkerColor(kBlue);
he->Draw("L");
f->Write();
return c1;
}
ROOT Version: Not Provided
Platform: Not Provided
Compiler: Not Provided