Compiler: gcc (GCC) 7.4.1 20190129
ROOT version: ROOT 6.14/09, built for linuxx8664gcc
Background info
Hi all, thanks in advance for any help. I’ve used the Combine statistical tool to generate some toys from the post-fit results of a two-dimensional maximum likelihood fit to data. The output of this method was sent to a file [1], which stored the results as a DataStore:
root [3] toys->Get("toy_1")->Print("V")
DataStore model_sData ()
  Contains 198 entries
  Observables:
    1)  jetmass_HIGH_default = 430  L(160 - 560) B(6)  "m_{#phi} (GeV)"
    2)       resmass_default = 2750  L(900 - 3500) B(9)  "m_{t#phi} (GeV)"
    3)   jetmass_SIG_default = 150  L(120 - 160) B(2)  "m_{#phi} (GeV)"
    4)   jetmass_LOW_default = 110  L(60 - 120) B(3)  "m_{#phi} (GeV)"
    5)           CMS_channel = SR_pass_SIG(idx = 4)
  "CMS_channel"
  Dataset variable "_weight_" is interpreted as the event weight
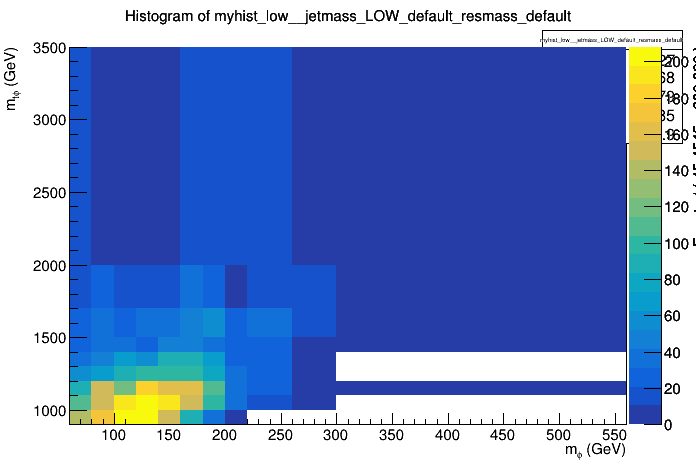
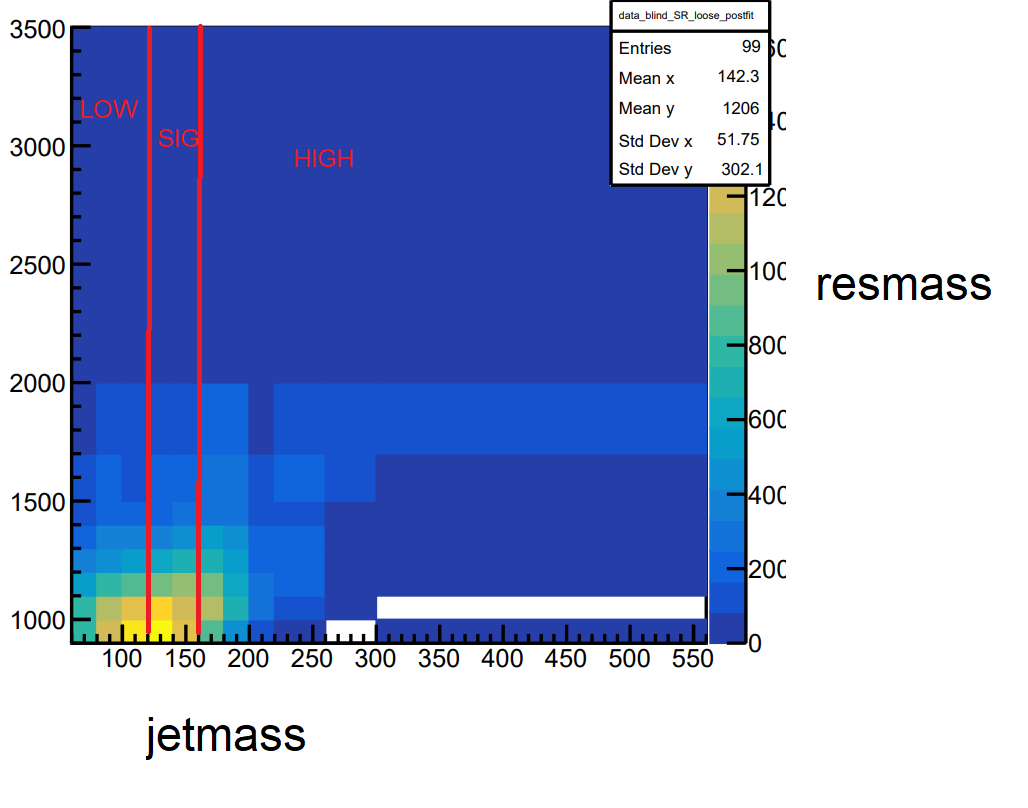
The 198 entries correspond to the 198 bins of the control and signal regions (SR_loose, and SR_pass), which are each divided into low- and high-mass sidebands (LOW/HIGH), as well as as a signal mass band (SIG) along the x-axis (jetmass_LOW/SIG/HIGH_default) of the distribution. These regions along x have different binnings (though they share boundaries) and are as follows:
LOW: [60,80,100,120]GeVSIG: [120,140,160]GeVHIGH: [160,180,200,220,260,300,560]
The binning along the y-axis (resmass_default) is variable, but the same for all regions in x:
[900,1000,1100,1200,1300,1400,1500,1700,2000,3500]
Here’s an example of what such a distribution looks like:
The problem
I’ve written a script [2] which performs the following steps:
- Loads the
RooDataSetfor the toy - Creates variable-binning
RooBinningobjects for theLOW/SIG/HIGHx-axis binnings and the common y-axis binning as described above reduce()s theRooDataSets to consider only the signal region of the toy (SR_pass)- Attempts to create a
TH2histogram from theRooAbsDataobjects from thereduce()operation
I am struggling with step 4. I’ve looked through the RooAbsData::createHistogram() documentation for my ROOT version, and I’m simply not familiar enough with RooFit to get this to work properly. The script is attached but is here as follows:
#include <TDirectoryFile.h>
#include <RooBinning.h>
#include <TH2.h>
#include <TFile.h>
#include <iostream>

using namespace RooFit ; // Binning() calls

void plot() {
    TFile f("higgsCombine_TEST.GenerateOnly.mH120.123456.root","READ");
    TDirectoryFile *toys = dynamic_cast<TDirectoryFile*>(f.Get("toys"));
    RooDataSet* rds = (RooDataSet*)toys->Get("toy_1");
    // set up boundary arrays for the variable binnings in Y
    const Double_t y_bins_low[10] = {900,1000,1100,1200,1300,1400,1500,1700,2000,3500};
    const Double_t y_bins_sig[10] = {900,1000,1100,1200,1300,1400,1500,1700,2000,3500};
    const Double_t y_bins_high[10] = {900,1000,1100,1200,1300,1400,1500,1700,2000,3500};
    Int_t nBins_y = 9;
    // set up binning object for Y
    // https://root.cern.ch/doc/v614/classRooBinning.html#a6711625008f039fa78c7960530a928d4
    RooBinning rb_y_low(nBins_y, *y_bins_low, "y_low");
    RooBinning rb_y_sig(nBins_y, *y_bins_sig, "y_sig");
    RooBinning rb_y_high(nBins_y, *y_bins_high, "y_high");

    // set up boundary arrays for the variable binnings in X
    const Double_t x_bins_low[4] = {60,80,100,120};
    const Double_t x_bins_sig[3] = {120,140,160};
    const Double_t x_bins_high[7] = {160,180,200,220,260,300,560};
    Int_t nBins_x_low = 3;
    Int_t nBins_x_sig = 2;
    Int_t nBins_x_high = 6;
    // set up binning objects for X
    RooBinning rb_x_low(nBins_x_low, *x_bins_low, "x_low");
    RooBinning rb_x_sig(nBins_x_sig, *x_bins_sig, "x_sig");
    RooBinning rb_x_high(nBins_x_high, *x_bins_high, "x_high");

    // reduce the RooDataSets
    RooAbsData *low = (RooAbsData*)rds->reduce("CMS_channel==CMS_channel::SR_pass_LOW");
    RooAbsData *sig = (RooAbsData*)rds->reduce("CMS_channel==CMS_channel::SR_pass_SIG");
    RooAbsData *high = (RooAbsData*)rds->reduce("CMS_channel==CMS_channel::SR_pass_HIGH");

    // make a histogram from one as a test
    TH2F* h_low = dynamic_cast<TH2F*>(low->createHistogram("jetmass_LOW_default,resmass_default",Binning(rb_x_low),Binning(rb_y_low)));
}
Obviously, this final line fails:
Processing plot.C...
In file included from input_line_8:1:
/home/amitav/JHU/TH/debugToys/plot.C:45:44: error: no matching member function for call to 'createHistogram'
    TH2F* h_low = dynamic_cast<TH2F*>(low->createHistogram("jetmass_LOW_default,resmass_default",Binning(rb_x_low),Binning(rb_y_low)));
                                      ~~~~~^~~~~~~~~~~~~~~
/home/amitav/miniconda3/envs/TIMBER/include/RooAbsData.h:180:8: note: candidate function not viable: no known conversion from 'RooCmdArg' to 'const RooAbsRealLValue' for 2nd argument
  TH1 *createHistogram(const char *name, const RooAbsRealLValue& xvar,
       ^
/home/amitav/miniconda3/envs/TIMBER/include/RooAbsData.h:186:8: note: candidate function not viable: no known conversion from 'RooCmdArg' to 'const RooAbsRealLValue' for 2nd argument
  TH1 *createHistogram(const char *name, const RooAbsRealLValue& xvar, const RooLinkedList& argList) const ;
       ^
/home/amitav/miniconda3/envs/TIMBER/include/RooAbsData.h:187:8: note: candidate function not viable: no known conversion from 'RooCmdArg' to 'Int_t' (aka 'int') for 2nd argument
  TH1 *createHistogram(const char* varNameList, Int_t xbins=0, Int_t ybins=0, Int_t zbins=0) const ;
       ^
I’ve got a script to stitch the three independent TH2s afterwards, but being able to call createHistogram() with variable binning would be really helpful.
I’ve managed to create a histogram with constant bin widths via, e.g.,
TH2F* low = dynamic_cast<TH2*>(low->createHistogram("jetmass_LOW_default,resmass_default",10,10))
but my hope was to call the createHistogram() overload that takes in Binning(RooAbsBinning& binning) with my variable binnings. What are the proper arguments to do this? Is it even possible to create a histogram with variable binnings like this? I hope I’m just missing something simple in the createHistogram() call. I’ve attached the script and input root file for easy reproduction of the error.
Thanks a lot in advance, and please let me know if anything is unclear.
Best,
Amitav
[1] higgsCombine_TEST.GenerateOnly.mH120.123456.root (85.6 KB)
[2] plot.C (2.1 KB)