ROOT Version: 6.18.00 Platform: UBUNTU 6.18.04 Compiler: Not Provided
I use Makeclass for generated the histogram to analyse data but now I want to do a graphic where each point is attributed to a data, using the same data.
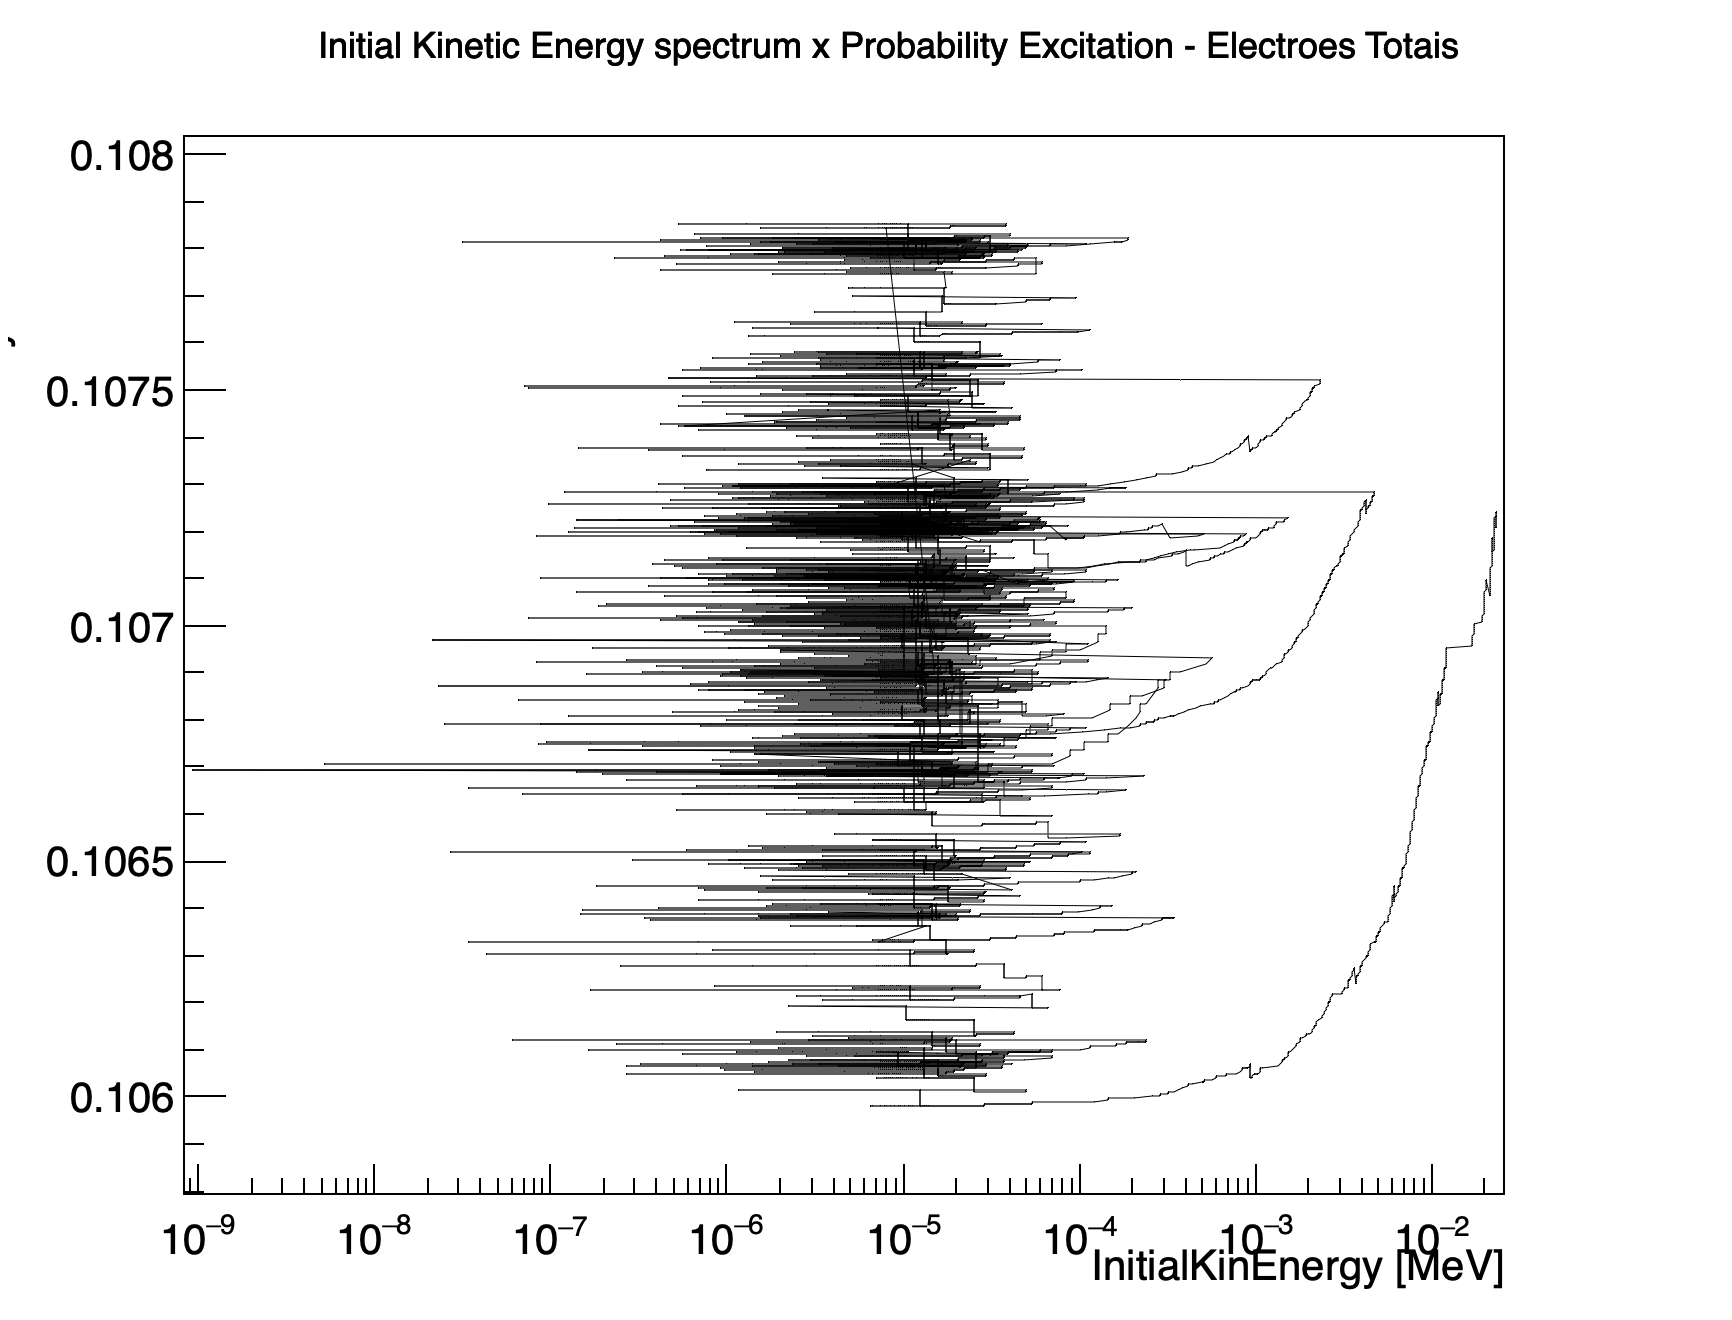
The code of histogram is in IonExc.C and the graphic is in graIonExc.C but I don’t know if the change that I did was enough. The graphic that I obtain with graIonExc.C is in the figure graphic, but I dont know why is give this.
When I run the graIonExc.C (makeclass) I obtain the image in graphic.pdf. The procedure is:
#define graIonExc_cxx
#include "graIonExc.h"
#include <TH2.h>
#include <TStyle.h>
#include <TCanvas.h>
#include <TGraph.h>
#include <TPad.h>

void graIonExc::Loop()
{
//   In a ROOT session, you can do:
//      root> .L graIonExc.C
//      root> graIonExc t
//      root> t.GetEntry(12); // Fill t data members with entry number 12
//      root> t.Show();       // Show values of entry 12
//      root> t.Show(16);     // Read and show values of entry 16
//      root> t.Loop();       // Loop on all entries
//

//     This is the loop skeleton where:
//    jentry is the global entry number in the chain
//    ientry is the entry number in the current Tree
//  Note that the argument to GetEntry must be:
//    jentry for TChain::GetEntry
//    ientry for TTree::GetEntry and TBranch::GetEntry
//
//       To read only selected branches, Insert statements like:
// METHOD1:
//    fChain->SetBranchStatus("*",0);  // disable all branches
//    fChain->SetBranchStatus("branchname",1);  // activate branchname
// METHOD2: replace line
//    fChain->GetEntry(jentry);       //read all branches
//by  b_branchname->GetEntry(ientry); //read only this branch
   if (fChain == 0) return;


   int nbins = 4500;
   int nbins1 = 450;
   gStyle->SetOptStat(1111);
   gStyle->SetPalette(57); //kRainBow
   gStyle->SetPalette(kRainBow);

   TCanvas *can2 = new TCanvas("can2","can2",900,700); //I
   TCanvas *can3 = new TCanvas("can3","can3",900,700); //air

     can2->SetFrameBorderMode(1);
     can2->SetLeftMargin(0.01);

     can3->SetFrameBorderMode(1);
     can3->SetLeftMargin(0.01);//*/

   // can2
   auto *ana2 = new TGraph(); //dose - control 250000 = 10^-12
  // can3
   auto *ana3 = new TGraph(); //dose - control 250000 = 10^-12


      can2->Divide(1,1);
      can3->Divide(1,1);

      can2->cd(1);//*/
      can3->cd(1);//*/

   Long64_t nentries = fChain->GetEntries();

   Long64_t nbytes = 0, nb = 0;
   for (Long64_t jentry=0; jentry<25;jentry++) {
      Long64_t ientry = LoadTree(jentry);
      if (ientry < 0) break;
      nb = fChain->GetEntry(jentry);   nbytes += nb;
      // if (Cut(ientry) < 0) cont1inue;

            cout<<"size = "<<nentries<<endl;
            cout<<" entry = "<<jentry<<endl;
                  cout<<endl;

     if(Step_FinalMaterial->size()>0){mm++;

      Int_t cont1=0;
      while((cont1<Step_FinalMaterial->size()-1)){cont1++;}//*/


      if((Step_FinalMaterial->at(cont1)=="G4_WATER")&&(Step_Particle->at(cont1)=="e-")){mm6++;


                for(Int_t l=0;l<Step_FinalMaterial->size();l++){mm7++;

                 if((Step_FinalProcess->at(l)=="e-_G4DNAIonisation")){Ion++;}
                 if((Step_FinalProcess->at(l)=="e-_G4DNAExcitation")){Exc++;}
                 if((Step_FinalProcess->at(l)=="e-_G4DNAElastic")){Elast++;}
                 if((Step_FinalProcess->at(l)=="e-_G4DNAVibExcitation")){VibExc++;}
                 if((Step_FinalProcess->at(l)=="e-_G4DNAAttachment")){Attac++;}

               if((0.0000074<Step_InitialKineticEnergy->at(l)<0.00001)){pIon = (Ion)/(Exc+Ion+VibExc);}else{{pIon = Ion/(Exc+Ion);}}
               if((0.0000074<Step_InitialKineticEnergy->at(l)<0.00001)){pExc = (Exc+VibExc)/(Exc+Ion+VibExc);}else{pExc = (Exc)/(Exc+Ion);}

                cout<<"Energy = "<<Step_InitialKineticEnergy->at(l)<<" Ion = "<<Ion<<" Exc = "<<Exc<<" VIbExc = "<<VibExc<<" DNA Attac = "<<Attac<<endl;

                ana2->SetPoint(l,Step_InitialKineticEnergy->at(l),pIon);
                ana3->SetPoint(l,Step_InitialKineticEnergy->at(l),pExc);
                 }

//cout<<"Energy = "<<Step_InitialKineticEnergy->at(cont1)<<" Ion = "<<Ion<<" Exc = "<<Exc<<" VIbExc = "<<VibExc<<" DNA Attac = "<<Attac<<endl;

        }

      }
  }

cout<<"event = "<<mm<<endl;
cout<<"event edep!=0 ="<<mm1<<endl;
cout<<"event edep!=0 e- ="<<mm12<<endl;

cout<<"event control ="<<mm6<<endl;
cout<<"STEP Total control="<<mm7<<endl;
cout<<"eventos OutOfWorld = "<<mm11<<endl;
cout<<"####------####"<<endl;
cout<<"####---control---####"<<endl;

cout<<"Total = " << mm7 << endl;
cout<<"Ionisation = " << Ion << endl;
cout<<"Perc. Ionisation = " << pIon << endl;
cout<<"VibExcitation = " << VibExc << endl;
cout<<"Perc. VibExcitation = " << pVibExc << endl;
cout<<"Excitation = " << Exc << endl;
cout<<"Perc. Excitation = " << pExc << endl;
cout<<"DNA Attachament = " << Attac << endl;
cout<<"Perc. DNA Attachament = " << pDNAAttac << endl;
cout<<"Elastic = " << Elast << endl;
cout<<"####---####"<<endl;

//#### draw histogram

//can control
////////////////////////////////***********************************////////////////////////////////////
can2->cd(1);
ana2 -> SetTitle("Initial Kinetic Energy spectrum x Probability Ionisation;InitialKinEnergy [MeV];Probabilty Ionisation");
ana2 -> SetFillColor(0);
gPad -> SetLeftMargin(0.1);
gPad -> SetRightMargin(0.15);
ana2->GetXaxis()->SetTitleOffset(1.3);
//anaPos->GetZaxis()->SetRangeUser(-0.6, 0.6);
gPad->SetLogx();
//gPad->SetLogy();
//ana2 -> ProjectionY("")->Draw();
ana2 -> Draw("");

can3->cd(1);
ana3 -> SetTitle("Initial Kinetic Energy spectrum x Probability Excitation - Electroes Totais; InitialKinEnergy [MeV]; Probabilty Excitation");
//ana3 -> SetNameTitle("energy2", "Initial Kinetic Energy spectrum x Probability Excitation - Electroes Totais; InitialKinEnergyss [MeV]; Probabilty Excitation; Counts");
ana3-> SetFillColor(0);
gPad->SetLeftMargin(0.1);
gPad->SetRightMargin(0.15);
ana3->GetXaxis()->SetTitleOffset(1.3);
gPad->SetLogx();
//anaPos->GetZaxis()->SetRangeUser(-0.6, 0.6);
//gPad->SetLogy();
ana3 -> Draw("");

// out file
TFile *p = new TFile("SPEC_TotElecDNA3B.root", "RECREATE"); // Sam 0.05mm

ana2->Write();
ana3->Write();

p->Write();

}
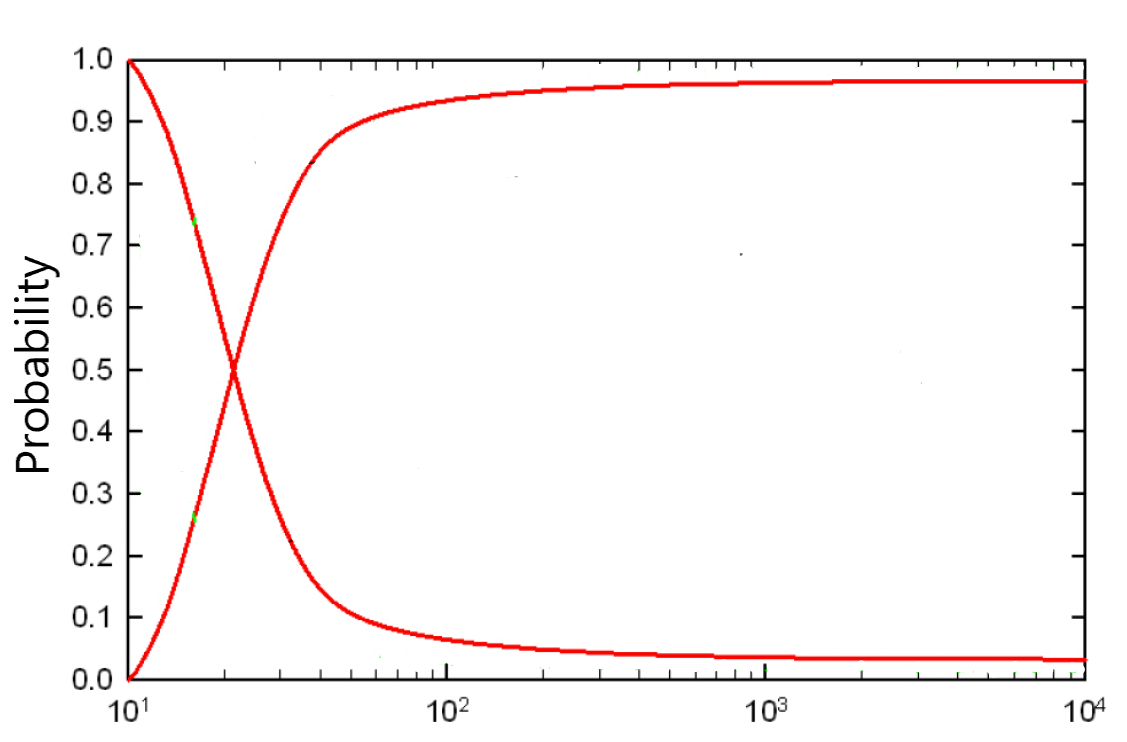
So when I run .L graIonExc.CgraIonExc b; and b.Loop() the graphic.pdf is generated. Maybe I do some wrong because what I expected was a sigmoide curve.
If wasn’t this that was expected @couet please said!
root [1] .L graIonExc.C
root [2] graIonExc b;
root [3] b.Loop()
Error in <TFile::TFile>: file /media/gamos/One Touch/gamos6/DNA/ELECDNA/seedTDNAElec2_tree_1000.root does not exist
Error in <TFile::TFile>: file /media/gamos/One Touch/gamos6/DNA/ELECDNA/seedTDNAElec2_tree_1001.root does not exist
Error in <TFile::TFile>: file /media/gamos/One Touch/gamos6/DNA/ELECDNA/seedTDNAElec2_tree_1002.root does not exist
Error in <TFile::TFile>: file /media/gamos/One Touch/gamos6/DNA/ELECDNA/seedTDNAElec2_tree_1003.root does not exist
Error in <TFile::TFile>: file /media/gamos/One Touch/gamos6/DNA/ELECDNA/seedTDNAElec2_tree_1004.root does not exist
Error in <TFile::TFile>: file /media/gamos/One Touch/gamos6/DNA/ELECDNA/seedTDNAElec2_tree_1005.root does not exist
Error in <TFile::TFile>: file /media/gamos/One Touch/gamos6/DNA/ELECDNA/seedTDNAElec2_tree_1006.root does not exist
Error in <TFile::TFile>: file /media/gamos/One Touch/gamos6/DNA/ELECDNA/seedTDNAElec2_tree_1007.root does not exist
Error in <TFile::TFile>: file /media/gamos/One Touch/gamos6/DNA/ELECDNA/seedTDNAElec2_tree_1008.root does not exist
Error in <TFile::TFile>: file /media/gamos/One Touch/gamos6/DNA/ELECDNA/seedTDNAElec2_tree_1009.root does not exist
Error in <TFile::TFile>: file /media/gamos/One Touch/gamos6/DNA/ELECDNA/seedTDNAElec2_tree_1010.root does not exist
........
Hi @couet. I believe that you have to use the file I place in the first message (file root - that is the first file in graIonExc.h) and comment the others files just to have an example. Sorry if I didn’t make it clear what the root file link would be in the first message.
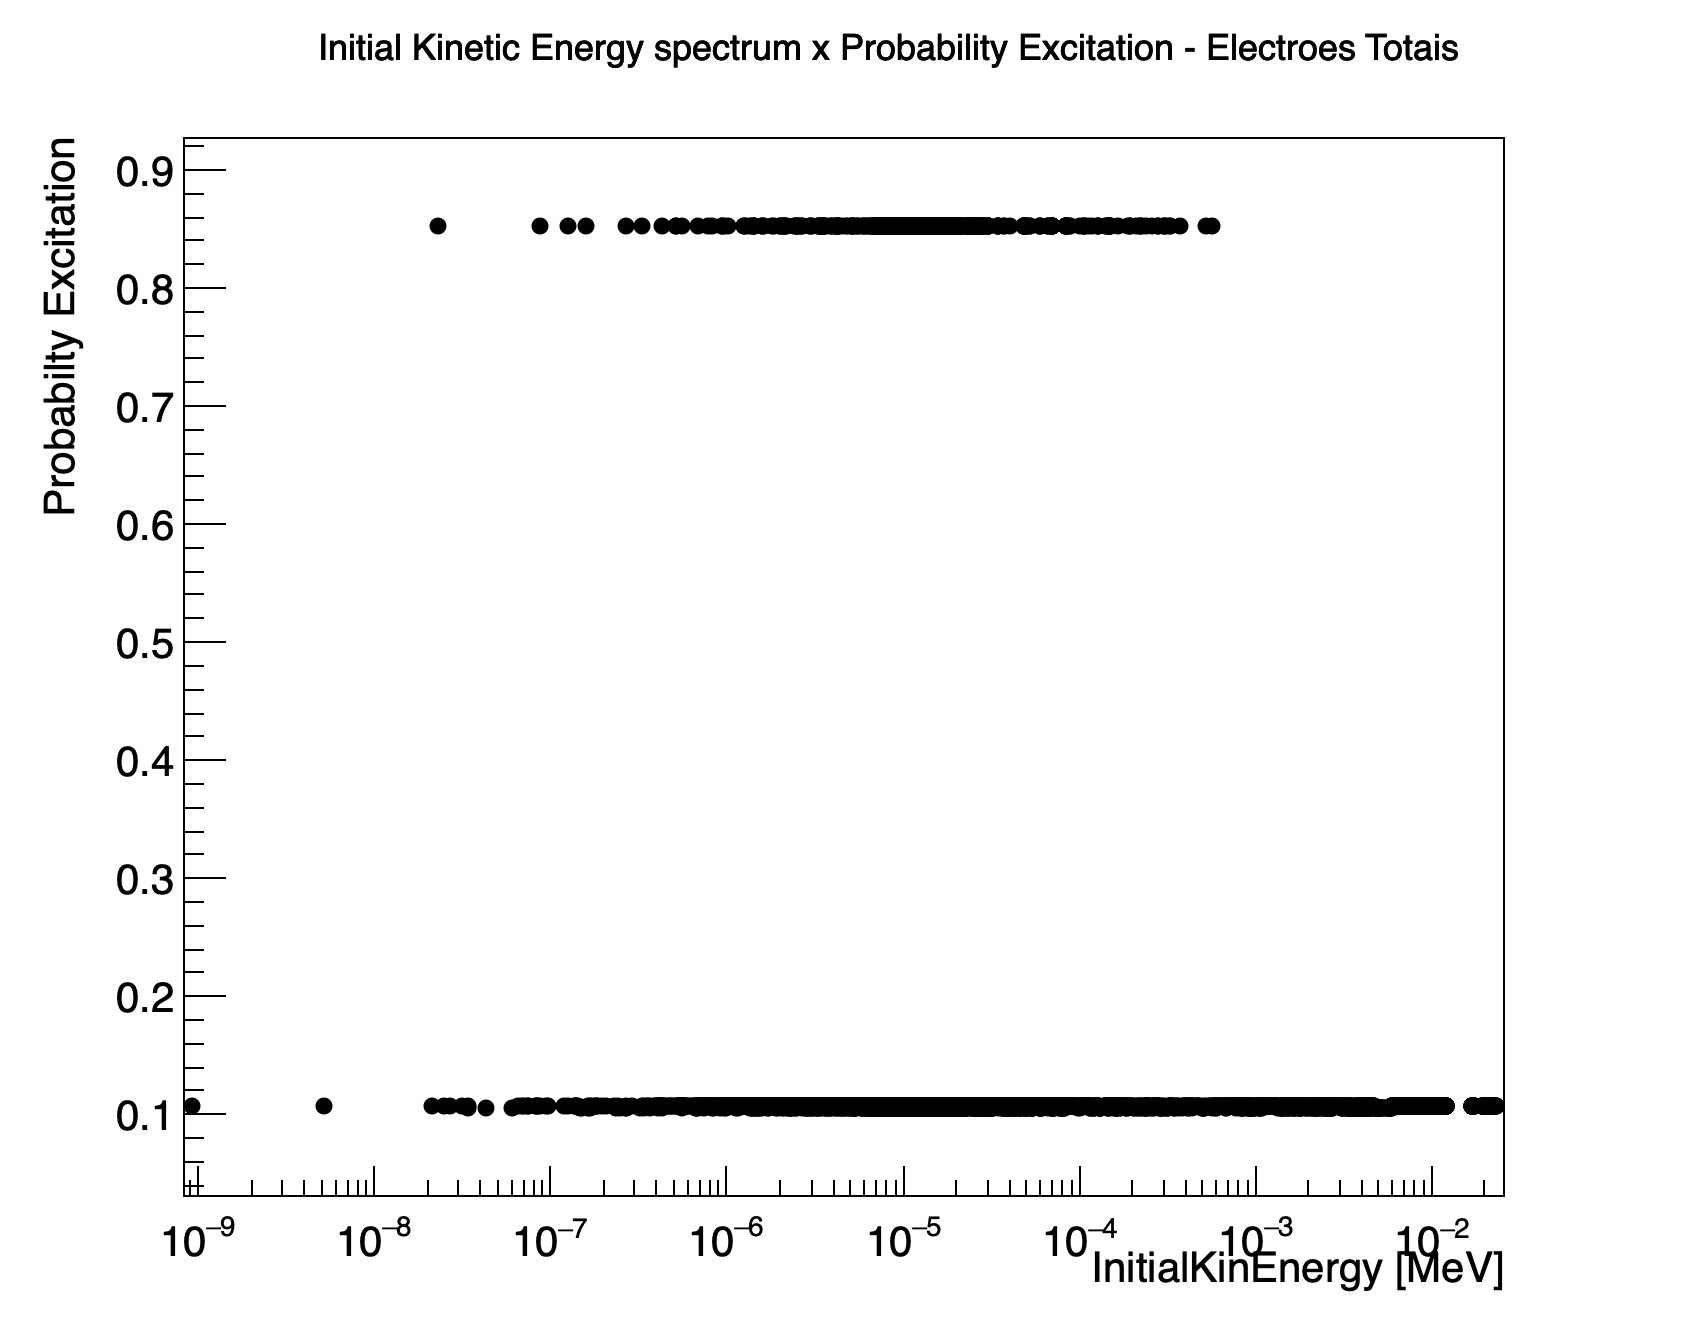
@couet Thanks for the help. I was tried acttualy to see the data in the histogram produce by the file IonExc1.C in a graphic but the data seems to be different as we see in the Excitation3.pdf because I think that the graphic was attribute each energy only one percentage.
Not really. That’s your analysis. I can help you will the plotting technical side but not on what you want to plot and how to generate it. May be some colleague next to you can help ? (plus your macro is really hard to debug for one not knowing the context)