I have two TH2D histograms -each corresponding to a different phenomenological model- which, independently drawn with the CONT4 option, result in two separate contour plots, each one showing regions of visibility of a certain signal. Both contour plots have the same x and y axes. Each contour plot has only two contour levels, so that each of them has only two regions: one in which the model is visible and one in which it isn’t.
I need to merge both contour plots into a single one, showing four different regions: one in which the signal predicted by model A alone is visible, one in which the signal predicted by model B alone is visible, one in which neither predicted signal is visible, and one in which both predicted signals is visible.
I have attempted to superimpose the two original contour plots, but I just end up having the top one covering the bottom one completely.
Do you have any ideas on how to merge the two plots?
I do need to fill the regions because, once I manage to merge the two contour plots, I will plot other curves (just lines). In this final plot, then, the colour of the background will indicate whether or not the curves shown in the foreground have any meaning within the context of one or the other model (A or B).
Could a possible solution be to use the LIST draw option for the TH2s to extract the contour lines as TGraph objects and then use these to build the merged contour plots?
If so, how could I fill the area between the curves when plotting the TGraph objects?
I had not time yet to run you example. I have something else to finish before. Sorry for that. Without running you example and without having seen in details what you want, my first guess would be that should group the 2 histogram into one. But may be that not the answer to your problem. I need more time.
That’s strange: when I run the macro, both histos are filled.
To check, I’ve copied-and-pasted the macro I posted (instead of using the one I had already on my computer), downloaded the txt files I had attached and re-run the macro, changing only
// Now draw the two histograms in a single, superimposed, plot
//h2B->Draw("CONT4SAME");
//h2C->Draw("CONT4SAME");
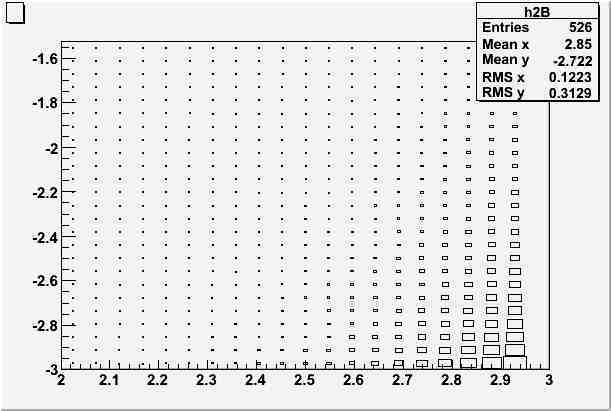
h2B->Draw("box");
and it does work.
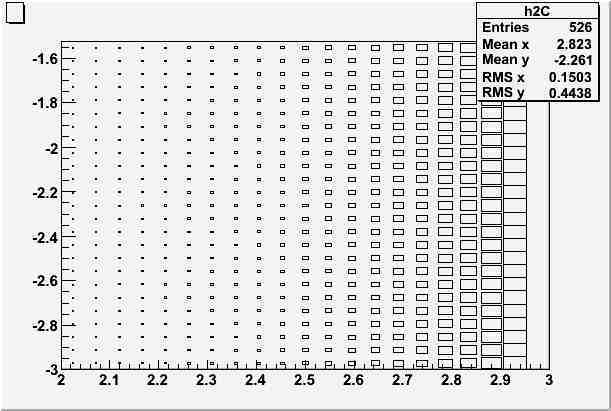
I am attaching the results of running h2B->Draw("box"); and
{
   ifstream f1,f2;

   Double_t alpha, zmax, SNR, zmaxMAX, zmaxMIN;

   zmaxMIN = 0.001;
   zmaxMAX = 0.03;

   TH2D *h2B = new TH2D("h2B"," ", 21, 2, 3, 25, log10(zmaxMIN), log10(zmaxMAX));
   f1.open("MODELCOMP_Enumin_10^5_SNRBB.txt");
   while(!f1.eof()){ // Fill the histogram
      f1 >> alpha >> zmax >> SNR;
      h2B->Fill(alpha, zmax, SNR);
   }
   f1.close();

   TH2D *h2C = new TH2D("h2C"," ", 21, 2, 3, 25, log10(zmaxMIN), log10(zmaxMAX));
   f2.open("MODELCOMP_Enumin_10^5_SNRKT.txt");
   while(!f2.eof()){ // Fill the histogram
      f2 >> alpha >> zmax >> SNR;
      h2C->Fill(alpha, zmax, SNR);
   }
   f2.close();

   // Define contour levels
   // Visibility condition: SNR>=3
   h2B->SetContour(2);
   h2B->SetContourLevel(0,3);
   h2B->SetContourLevel(1,10000.0); //10000 is a high, non-existing, level
   h2C->SetContour(2);
   h2C->SetContourLevel(0,0); //0 is a low, non-exiting, level
   h2C->SetContourLevel(1,3);

   // Show colour legend and palette
   h2B->GetZaxis()->SetLabelSize();
   gStyle->SetPalette(16);

   // Now draw the two histograms in a single, superimposed, plot
   h2B->SetLineColor(2);
   h2B->Draw("cont3");
   h2C->SetLineColor(3);
   h2C->Draw("cont3 same");
}
I get the attached picture. That’s it the simplest way to show the two histograms as contours on the same plot. On this plot what area would you like to fill with color ? As you see the two plots are crossing so that’s not obvious define what area should be colored"
Well, I am attempting to fill different areas with different colors (they will be shades of gray in the final version of the plot) [see attached image]: the area from the left up to the first red curve should have one color; the area from here to the first green curve, another; and the area from the first green curve to the second green curve, a different one.