How to make one-dimensional plots of many different measurements on one graph

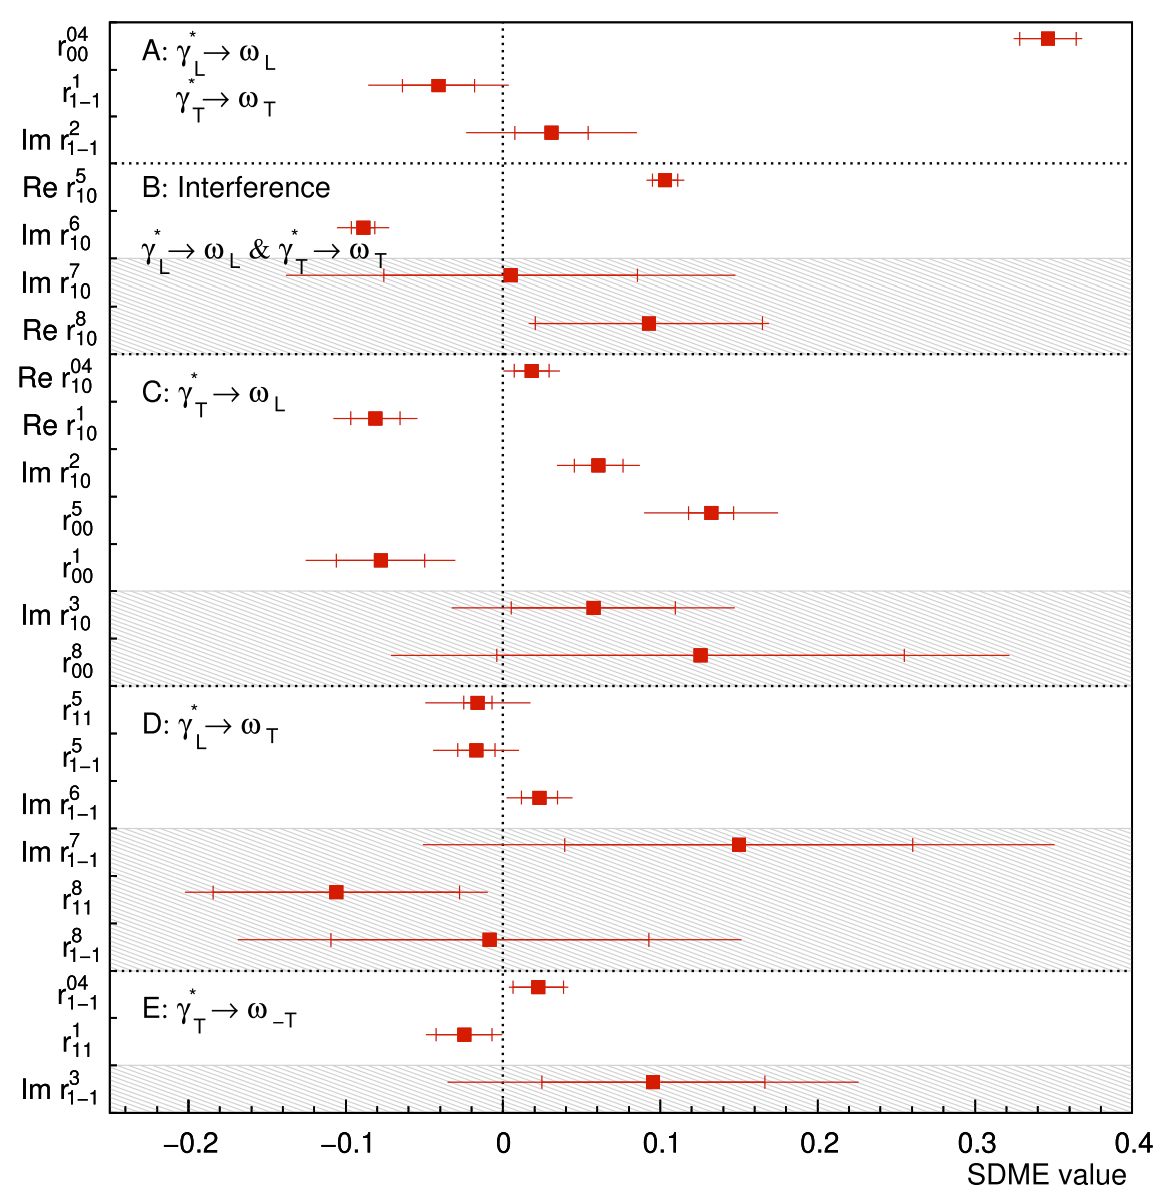
I am not sure what the name for this plot would be, but I want to do something similar to this plot from a COMPASS paper where they plot many different matrix element values on a single plot. Is this possible in ROOT? (Plot comes from G. D. Alexeev et al., “Spin density matrix elements in exclusive ω meson muoproduction”, Eur. Phys. J. C 81 (2021).)

ROOT Version: 6.24/02
Platform: Ubuntu 20.04
Compiler: gcc 9.4.0

Hi,

may be the TGraphErrors option “||” describe here: ROOT: TGraphPainter Class Reference
Is what you are looking for? (to draw these vertical ticks in the error bars). For the special labels on the vertival axis you should use ChangeLabel.

This topic was automatically closed 14 days after the last reply. New replies are no longer allowed.