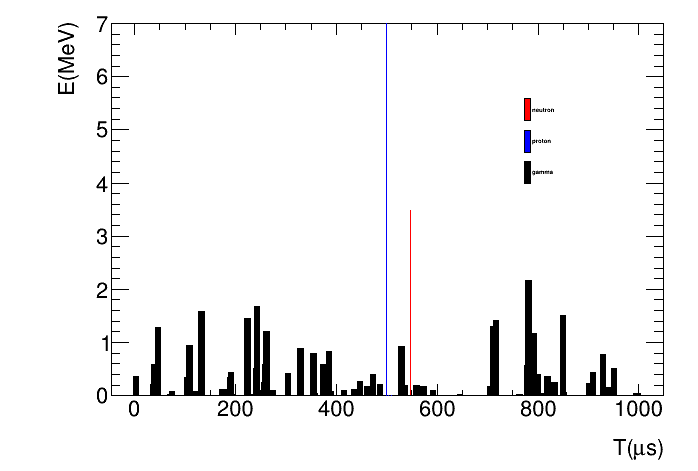
of course,this is my marco producing this plot.
Thanks for your reply
but I am a new user and I can’t put links in posts,so I copy the code
void Plot(){

    //first signal

    double T1[19]={510.322144,509.766327,504.232727,500.531799,500.330902,500.220673,500.171753,

    500.128693,500.126160,500.124023,500.080505,500.017395,500.011963,500.010590,500.010468,500.004456,

    500.004456,500.003662,500.000214};

    double E1[19]={0.000000,0.000000,0.000000,0.000000,0.000000,0.000239,0.000054,0.000006,0.000055,

    0.000063,0.000208,0.000902,0.005281,0.003558,0.001541,0.000226,0.007585,1.823839,22.037746};


    //second signal

    double T2[79]={930.199097,59.066494,259.636383,996.000671,183.151382,224.914047,40.539406,196.609207,799.846436,175.618958,243.115768,191.941025,779.594910,562.219360,807.288452,106.077843,645.730042,819.991638,

    257.171326,910.074890,530.264404,818.725342,125.255585,473.274750,133.631302,941.841553,110.174286,105.932861,

    242.506638,329.845459,386.853455,951.228455,416.125549,4.311274,833.339111,592.798340,257.849396,902.698975,431.808746,

    466.161316,37.251663,575.126221,707.467407,764.270813,468.429901,793.282104,711.249695,243.695038,120.749832,

    536.048340,909.416321,462.814301,560.054138,782.399414,569.032471,75.633476,852.168640,305.110077,717.813232,

    262.484100,232.841492,190.389297,47.598911,357.749207,850.331970,436.458435,705.766479,375.149567,177.358765,

    706.738586,374.692963,390.718353,71.078316,275.897858,998.307190,448.144043,488.151611,356.031158,706.838867};

    double E2[79]={0.766118,0.009947,0.582449,0.044219,0.014582,1.445117,0.583489,0.016852,0.393315,0.113346,1.673772,0.430160,0.567704,0.165600,0.030933,

    0.338217,0.016658,0.352000,0.253876,0.428912,0.926359,0.052335,0.078642,0.390775,1.583078,0.158898,0.951144,0.030970,

    0.514076,0.890536,0.824522,0.509718,0.092931,0.362073,0.247224,0.100024,0.159681,0.224975,0.011587,0.133011,0.209495,

    0.168628,0.021074,0.025601,0.073980,1.178202,1.295238,1.019816,0.083982,0.198915,0.237646,0.167872,0.181808,2.158459,

    0.165367,0.084864,0.067899,0.414959,1.408727,1.199913,0.012853,0.342225,1.284103,0.037600,1.499228,0.117350,0.165219,

    0.127487,0.117890,0.086140,0.580852,0.070860,0.025740,0.105955,0.042483,0.261705,0.213450,0.785225,0.020436};

    //third signal

    double T3[1]={546.616211},E3[1]={3.489695};

    //draw

    TMultiGraph *gr=new TMultiGraph();

    TGraph *gr1=new TGraph(19,T1,E1);

    TGraph *gr2=new TGraph(79,T2,E2);

    TGraph *gr3=new TGraph(1,T3,E3);

    gr1->SetFillColor(kBlue);

    gr2->SetFillColor(kBlack);

    gr3->SetFillColor(kRed);

    gr->Add(gr1);

    gr->Add(gr2);

    gr->Add(gr3);

    gr->GetYaxis()->SetTitleOffset(0.8);

    gr->GetYaxis()->SetTitle("E(MeV)");

    gr->GetXaxis()->SetTitle("T(#mus)");

    gr->SetMinimum(0);

    gr->SetMaximum(7);

    gr->Draw("AB");

    TLegend *lg=new TLegend(0.75,0.6,0.8,0.8,"");

    lg->SetFillColor(0);

    lg->AddEntry(gr3,"neutron","F");

    lg->AddEntry(gr1,"proton","F");

    lg->AddEntry(gr2,"gamma","F");

    lg->Draw("same");

}