Hello,
I would like to know if there is a way with ROOT to impose to a family of plots
to keep the same exponent N in the term x10-N for the ordinate axis values, written at
the top of the plot window ?
It seems there is no control on the N value.
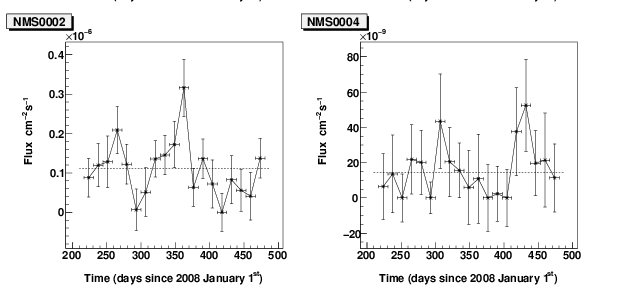
I append a example of two such curves : NMS0002 with N=6 and NMS0004 with N=9.
I do not want to modify the yrange, which is good, but just force N=6 on the plot of
NMS0004 and have the same plot but with values : 0.080, 0.060 , 0.040 …
on the ordinate axis.
This would allow a easier comparison of the two plots.
Thanks for your help,
David Landriu
PS:
I am currently working with root ROOT-v5.20.00-gl1
on a linux system :
uname -a
Linux saplxglast.extra.cea.fr 2.6.9-42.0.10.ELsmp #1 SMP Tue Feb 27 12:38:15 EST 2007 x86_64 x86_64 x86_64 GNU/Linux