Hello!
I am novice in deconvolution theme.
I have several questions.
May be you can help me.
Root version is 5.34/36.
My system: Scientific Linux release 7.2 (Nitrogen).
My gcc: gcc (GCC) 4.8.5 20150623 (Red Hat 4.8.5-4).
My problem:
My signal (channels vs time) is sum of overlapped individual signals (around 300 individual signals).
I want to find true start time and amplitude(if there is double or triple signal) of individual signals .
I know pulse shape for individual signal.
I know two solutions for this problem (if you know another, please, let me know):
- fitting by sum of individual signals
- deconvolution
For my previous task I used 1st method, because I had only 2 or 3 overlapped individual signals and data were noisy.
Now I decided to use 2nd method, because I have too many overlapped signals and data are not so noisy.
I wrote simple code to simulate different cases:
void unfold_vlad()
{
TSpectrum *s = new TSpectrum();
const double time_scale = 0.1;
const int numberIterations = 10000;
const int numberRepetitions = 1;
const int boost = 1;
const double response_rangle_from = -15;
const Int_t ssize = 700;
float source[ssize];
float response[ssize];
float xv_response[ssize];
cout << "ssize = " << ssize << endl;
for (int i = 0; i < ssize; ++i)
{
double time = i*time_scale + response_rangle_from;
xv_response[i] = time;
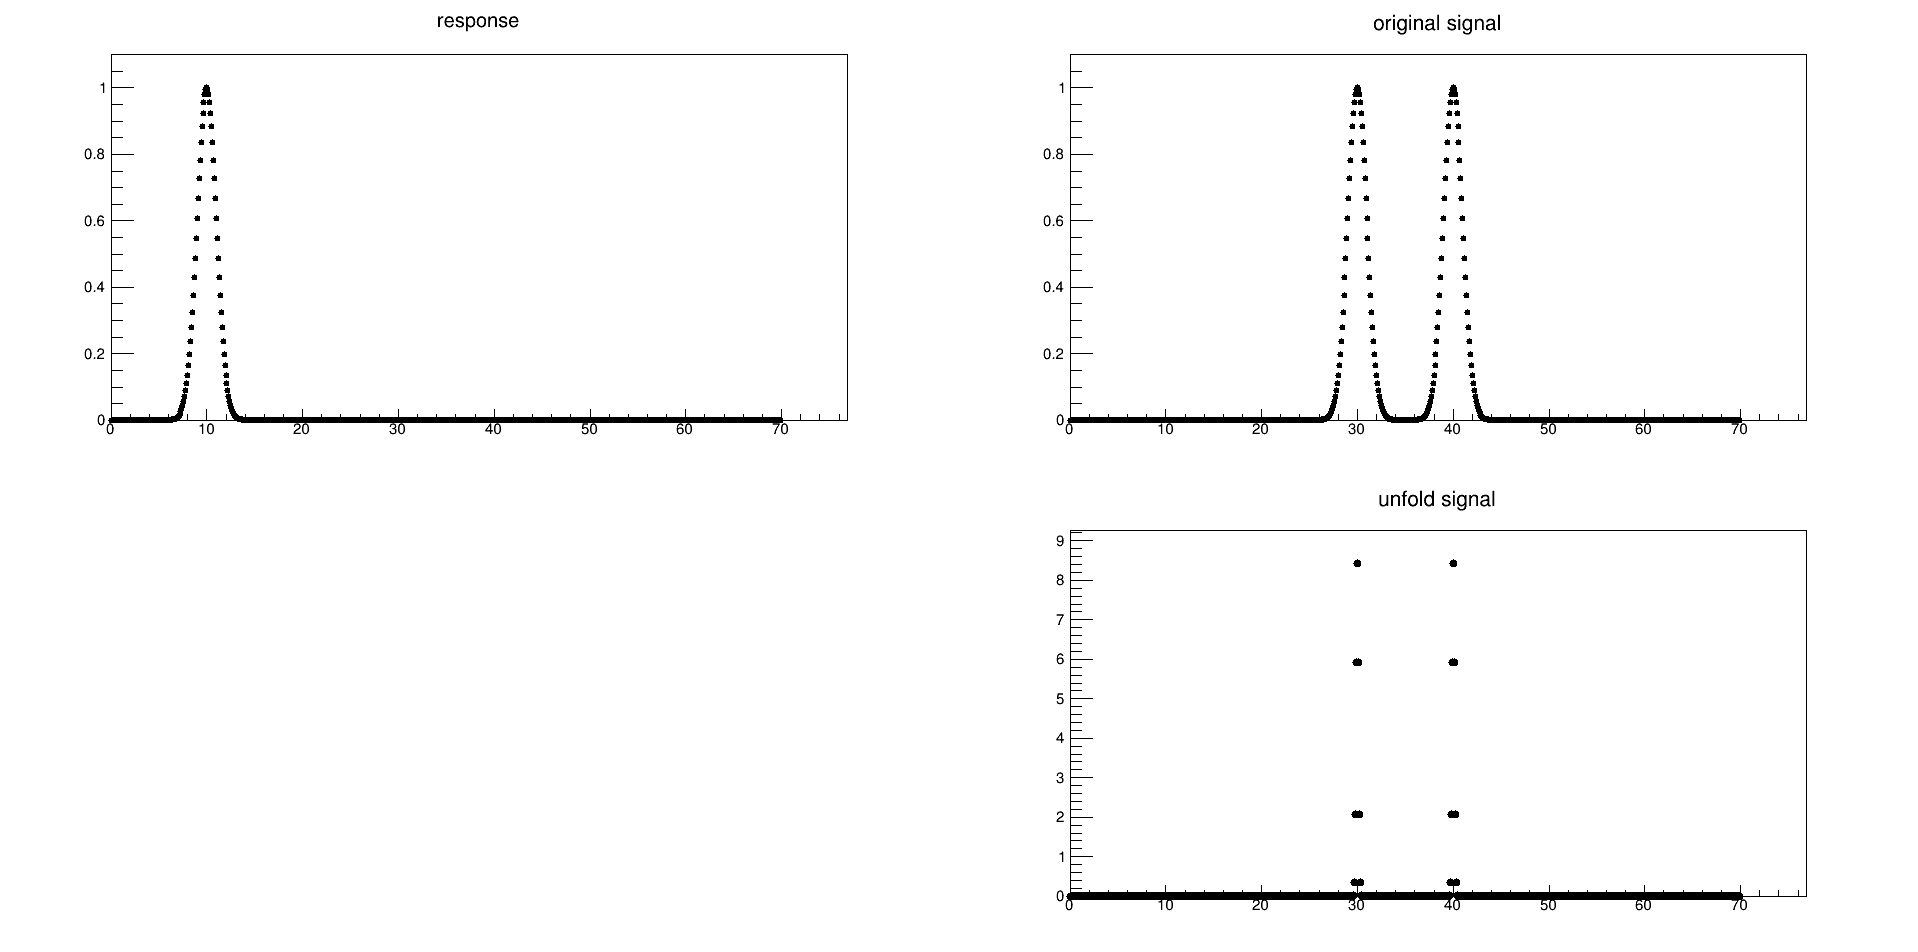
response[i] = TMath::Gaus(time, 0);
source[i] = (TMath::Gaus(time, 30) + TMath::Gaus(time, 40));
}
TCanvas* canv = new TCanvas("c", "c", 0, 0, 1900, 1500);
canv->Divide(2, 2);
TGraph *graph = new TGraph(ssize, &xv_response[0], &response[0]);
graph->SetTitle("response");
graph->SetMarkerStyle(20);
graph->SetMarkerSize(0.7);
canv->cd(1);
graph->Draw("AP");
TGraph *graph_source = new TGraph(ssize, &xv_response[0], &source[0]);
graph_source->SetTitle("original signal");
graph_source->SetMarkerStyle(20);
graph_source->SetMarkerSize(0.7);
canv->cd(2);
graph_source->Draw("AP");
s->Deconvolution(source,response,ssize,numberIterations,numberRepetitions,boost);
TGraph *graph_unfold = new TGraph(ssize, &xv_response[0], &source[0]);
graph_unfold->SetTitle("unfold signal");
graph_unfold->SetMarkerStyle(20);
graph_unfold->SetMarkerSize(0.9);
canv->cd(4);
graph_unfold->Draw("AP");
}This code gives expected result:

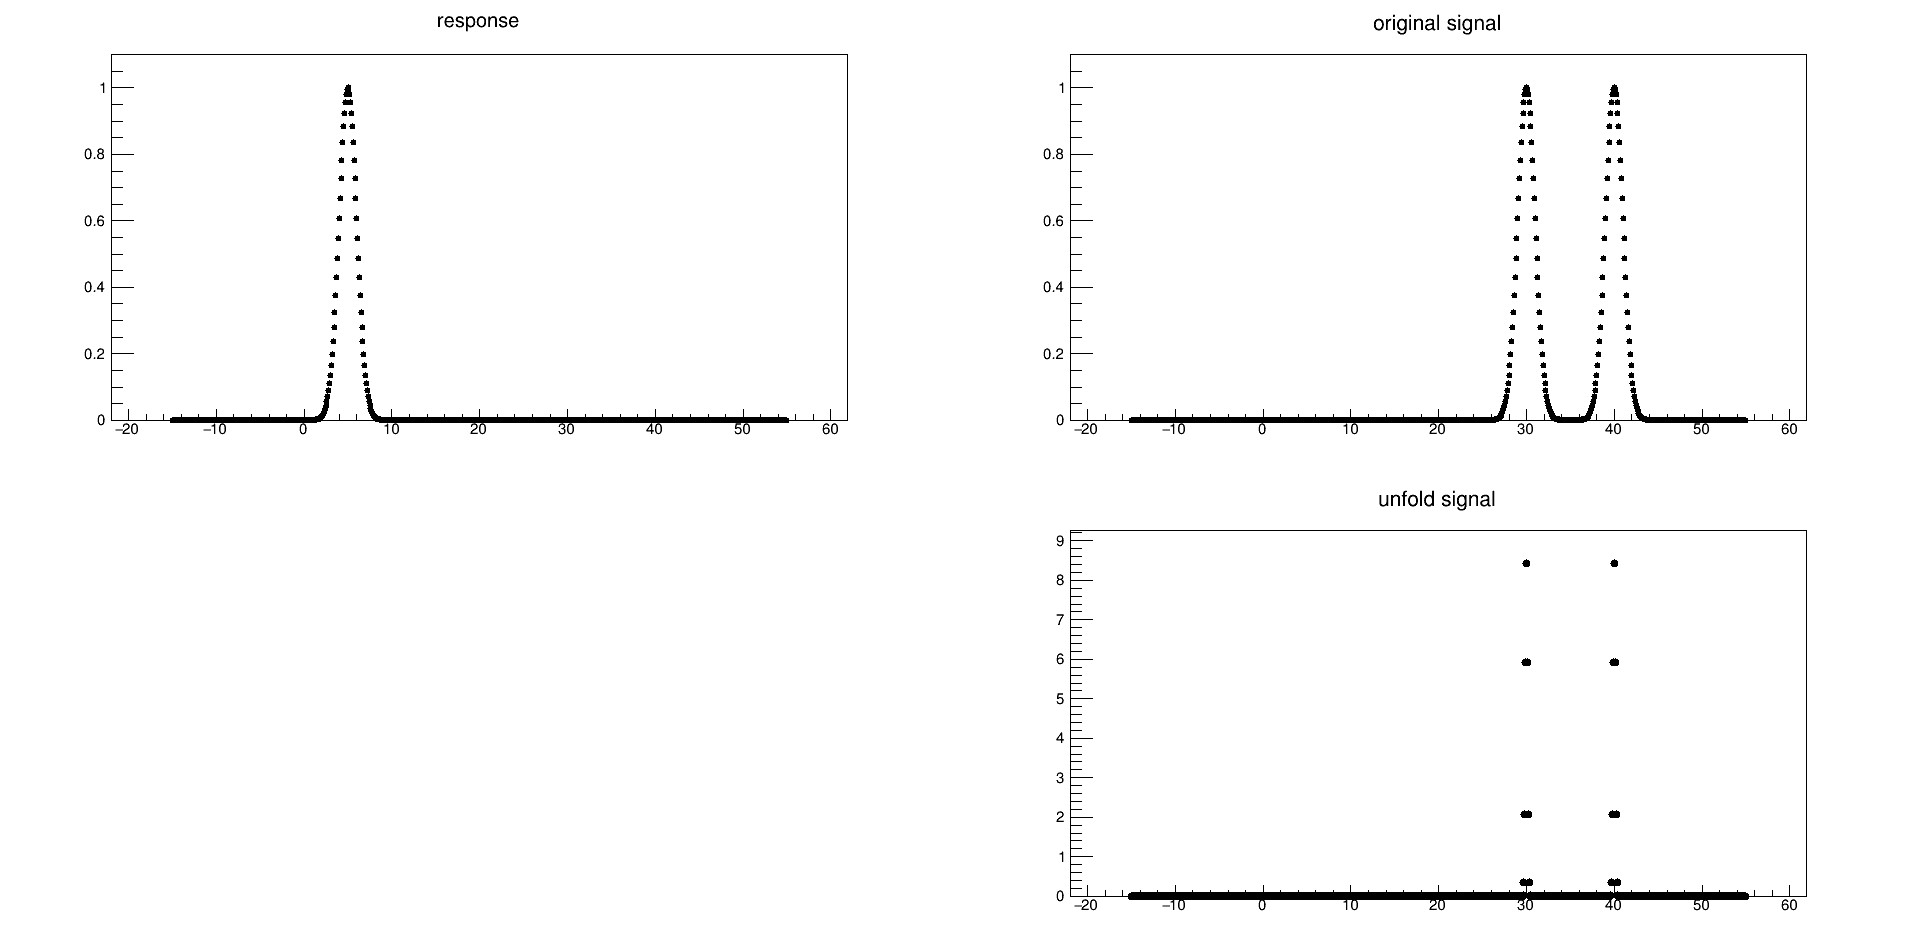
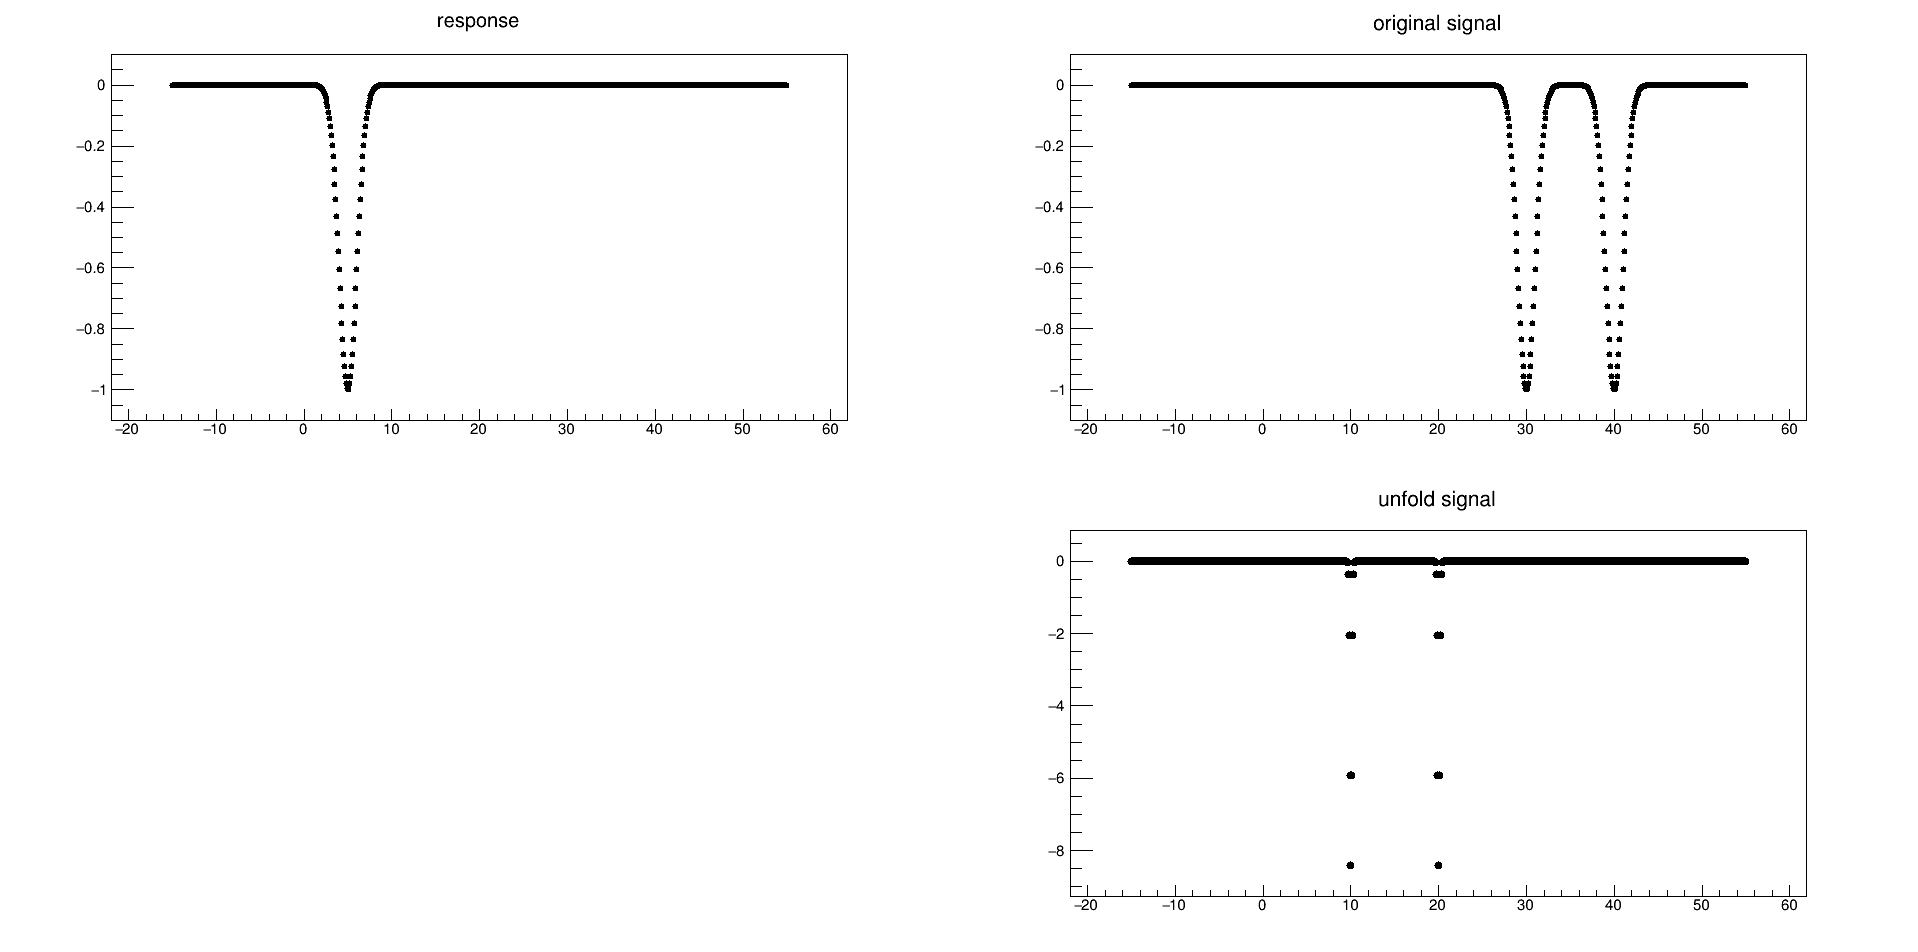
But I confused, because for shift response I have the same unfold signal:
response[i] = TMath::Gaus(time, 5);
source[i] = (TMath::Gaus(time, 30) + TMath::Gaus(time, 40));
Result (I expected delta-functions at 25 and 35):
The negative value gives the same result(I expected delta-functions at 35 and 45):
response[i] = TMath::Gaus(time, -5);
source[i] = (TMath::Gaus(time, 30) + TMath::Gaus(time, 40));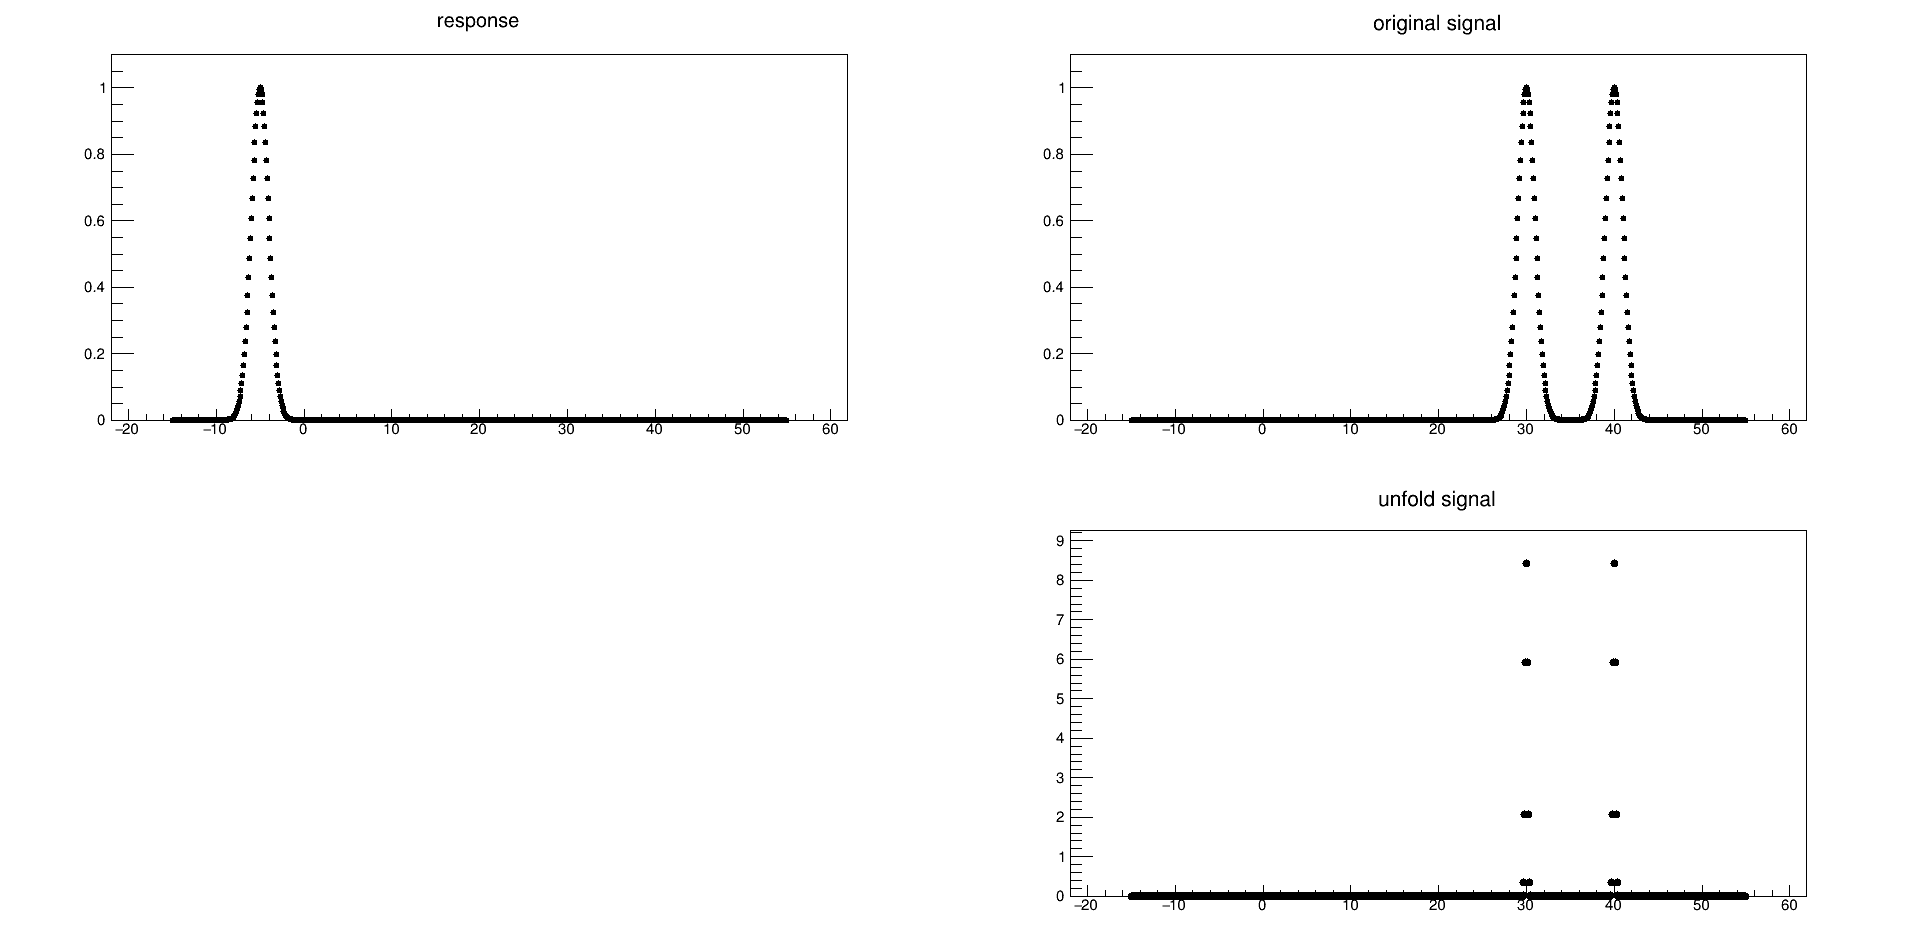
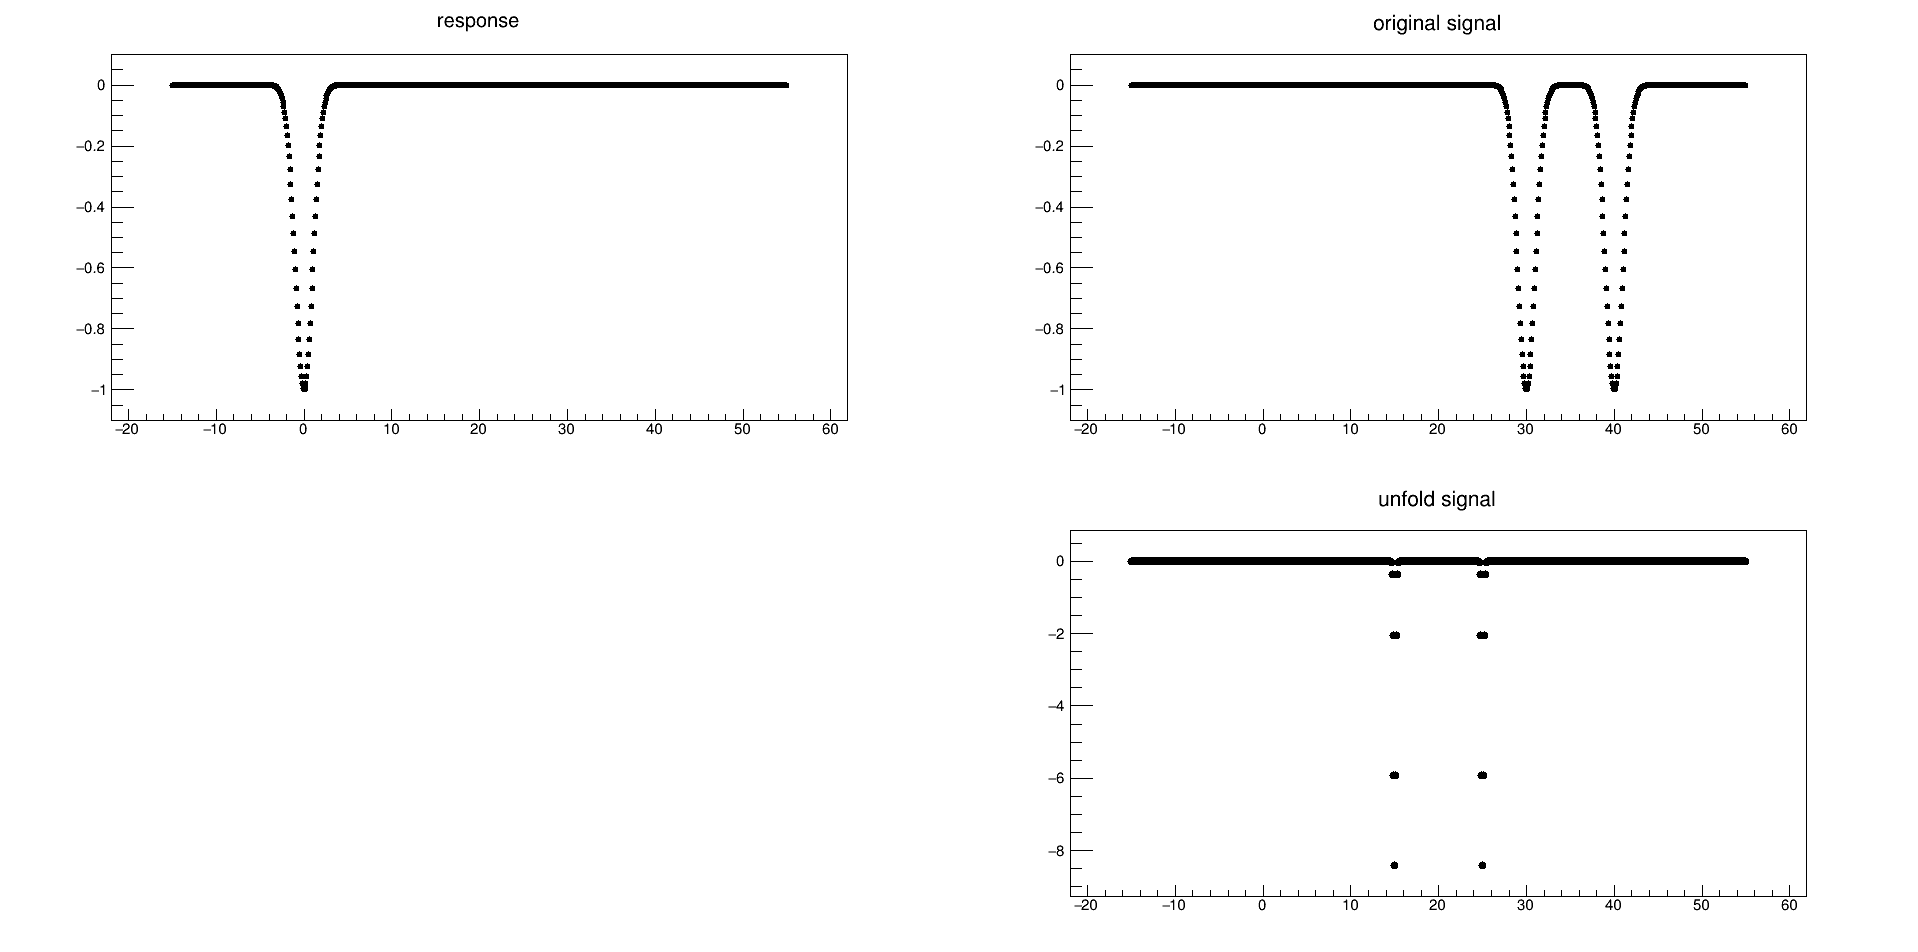
For negative amplitudes I see strange results too.
For
response[i] = -TMath::Gaus(time, 0);
source[i] = -(TMath::Gaus(time, 30) + TMath::Gaus(time, 40));
Result:
For
response[i] = -TMath::Gaus(time, 5);
source[i] = -(TMath::Gaus(time, 30) + TMath::Gaus(time, 40));
Result:
For
response[i] = -TMath::Gaus(time, -5);
source[i] = -(TMath::Gaus(time, 30) + TMath::Gaus(time, 40));
Thank you in advance.
Best regards, Vladislav.