This is in continuation to another question, which was answered yesterday (which I would have loved to link, but the forum does not allow me).
Continuing from that, I have a very big 2D matrix (1000x998), from which I want to extract the 2D contour of the areas that are less than 1. Thanks to dastudillo, I have managed this, with the single problem that it’s not quite right and it seems to be due to the fidelity/smoothness of the TGraph2D.
My data is quite smooth, as you cannot see here (I uploaded it to Google Drive because it is an 8 MB file, but the forum isn’t letting me put the link in!)
However, when I plot the TGraph2D, it’s not exactly as smooth
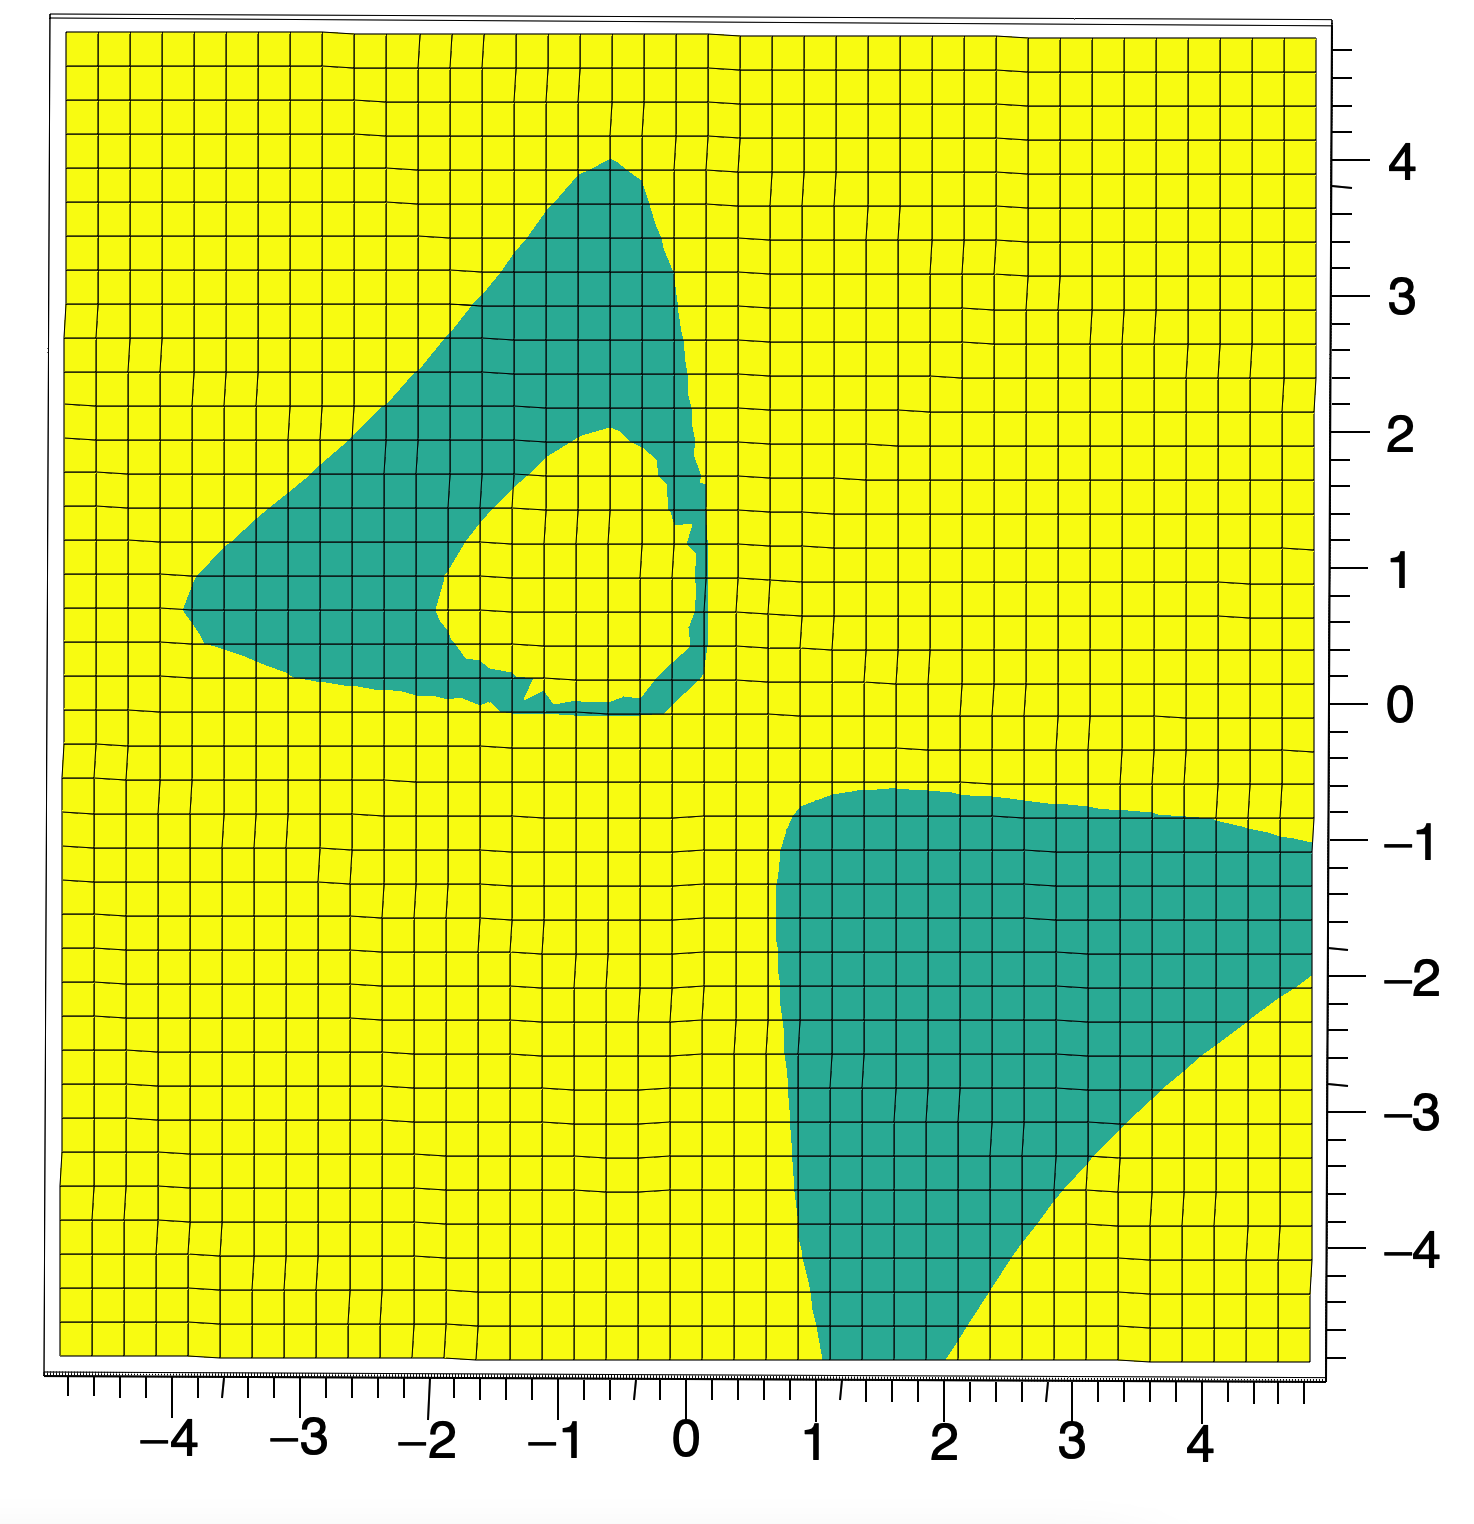
Honestly, this would be extremely fine, if it were not for that upper left section. Especially in the thinner blue section near the x=0 and y=0 axes, where my function varies a bit steeply, some weird artifacts appear. Even that would be fine, but the contours I am extracting using LIST CONT present this section as not even being continuous. Instead, it has two weird cuts

Now, I have manually gone in the data and checked that those two small areas that cut the yellow ‘donut’ shape should actually be yellow as well, as they are below 1 in value, so this is an error.
Is there anything I can do to improve the quality/fidelity/smoothness of these contours so that this problem disappears?
Thank you very much.