@couet@Wile_E_Coyote
Hi !
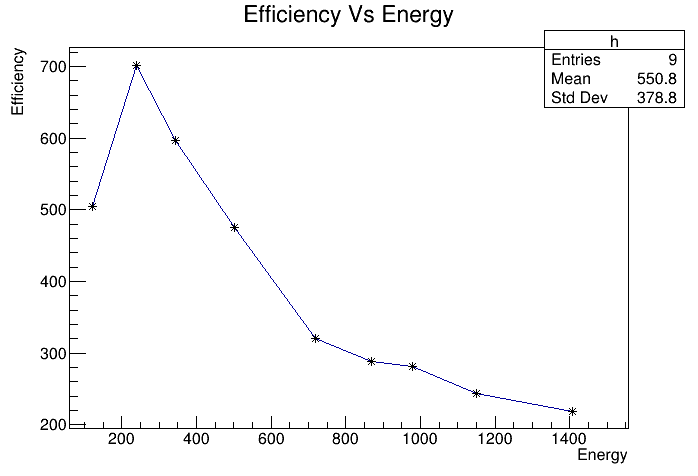
I have drawn a histogram (Efficiency vs Energy).
I got the value of efficiency by using formula Efficiency = (A/B) for different points in the graph.
Now, I want to include the errors by using the following:
If error in A = delta_A and error in B is delta_B, then error_Efficiency = efficiency x Sqrt [(delta_A /A)^2 + (delta_B /B)^2]
where delta_A = Sqrt (A) , delta_B = Sqrt (B).
Till now i have plotted the curve.
Below is the text file effvsE.txt (218 Bytes)
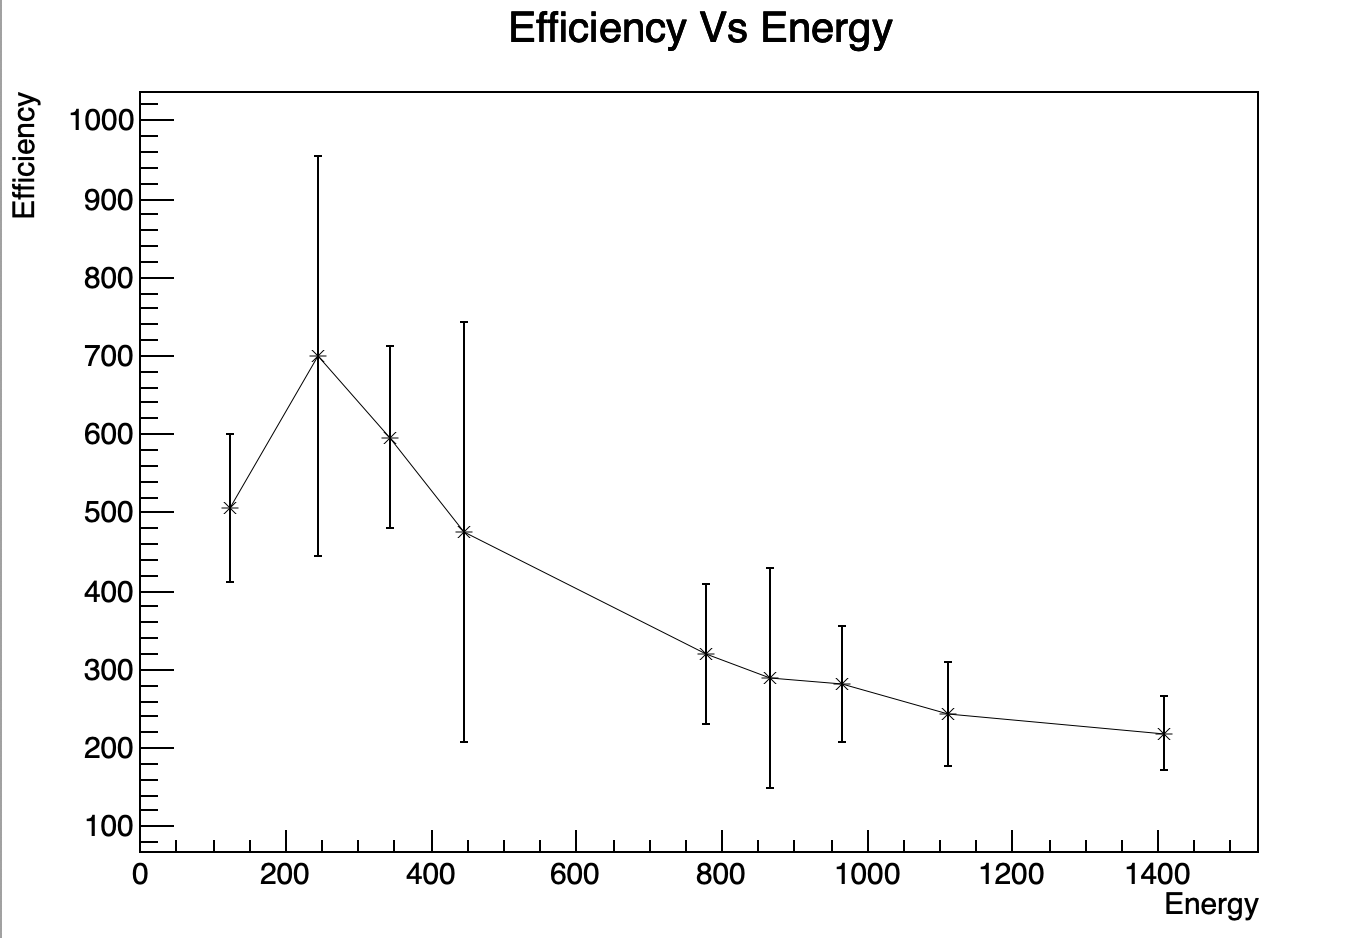
which includes x,y,z where z denotes error.
The code that i was using is the following:
#include "TFile.h"
#include "TGraphErrors.h"
#include "TF1.h"
void efficiency() {
   ifstream mydat("effvsE.txt");
   TCanvas* c1 = new TCanvas("c1","Graph");
   float x,y,z;

   auto g = new TGraphErrors();
   int i = 0;

    while(!mydat.eof()) {
      if (mydat >> x >> y >> z) {
         g->SetPoint(i,x,y);
         i++;
      }
    }

   g->SetMarkerStyle(3);
   g->Draw("ALP");
   g->SetTitle("Efficiency Vs Energy");
   g->GetXaxis()->SetTitle("Energy");
   g->GetYaxis()->SetTitle("Efficiency");
   mydat.close();
}
This is just showing the graph that i was getting earlier when z is not written and Tgrapherrors are not making any difference.
Tell me where i am doing some mistake.
void efficiency() {
   ifstream mydat("effvsE.txt");
   TCanvas* c1 = new TCanvas("c1","Graph");
   float x,y,z;

   auto g = new TGraphErrors();
   int i = 0;

    while(!mydat.eof()) {
      if (mydat >> x >> y >> z) {
         g->SetPoint(i,x,y);
         g->SetPointError( i, 0, z);
         i++;
      }
    }

   g->SetMarkerStyle(3);
   g->Draw("ALP");
   g->SetTitle("Efficiency Vs Energy");
   g->GetXaxis()->SetTitle("Energy");
   g->GetYaxis()->SetTitle("Efficiency");
   mydat.close();
}