I want to generate calorimeter lego plots in ROOT to visualize events in eta-phi plane. I have the eta, phi and pt values of the events, but I don’t understand how to make the calorimeter lego plots using TEveCaloLego in python 2.7. Following are the details of my system,
It would have been better if I can do it in ROOT 5.
If you can tell the procedure for the higher version of ROOT, then I can try to incorporate in my version of ROOT.
Calorimeter Lego Plots are special lego plots not drawn by the general purpose painters. They are part of the Events display package. See the eve tutorials.
Or, may be, these special options can help ?
Thank you for the suggestion.
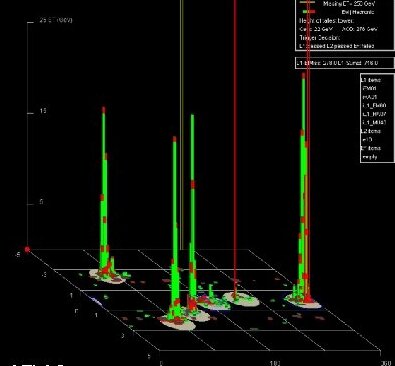
I have managed to draw the plot attached herewith QCD_Event_v2.pdf (256.0 KB)
Is there any way/option to show the jet radius and the jet axis in the plot ?
Well , try to get ideas from the example I sent. You can use the the option “0” in addition to the LEGO option to not draw the empty bins. I am not sure it works with ROOT 5 …