How to implement a horizontal shift for RooHistPdf

Hi,

I have a particular pdf shape in the form of a RooHistPdf which I get from a template histogram.
I would like to fit just for a horizontal shift of this fixed shape - left and right. How can I define a RooHistPdf that allows a free parameter defining this possible shift?

I tried to create a RooHistPdf using a RooFormulaVar as the independent variable ( defined by eg. x - xoffset, where xoffset would be my free parameter to be floated in the fit), but this results in a Seg Fault.

Is it possible to do what I describe in RooFit?

Thanks.
Si

Are there any new on this topic? I do not even need to fit to the horizontal shift. It would be enough to simply shift the Shape manually (Even though a fit would be better).

Hello @Emil_R ,

this is a post from 2013 that must have fallen through the cracks. Your best bet is probably to create a new thread describing your specific problem from the start.

Cheers,
Enrico

Edit: this answer recommends using the RooLinearVar, but it’s probably better to use the more tested RooFormulaVar as explained in my second post.

Hi @Emil_R,

it’s still a good question though!

You can’t create a RooHistPdf for a non-fundamental variable like a RooFormulaVar, as attempted in the original post. But this is what the RooLinearVar there for: it behaves like a fundamental variable, but is actually a linearly transformed fundamental variable.

You can therefore use it to implement your horizontal shift. Just create your RooDataHist for the template and the RooHistPdf for the shifted variable, the RooLinearVar:

// Helper function to create the RooDataHist for the template shape
std::unique_ptr<RooDataHist> createDataHist()
{
    RooRealVar xShifted{"x_shifted", "x_shifted", 0.0, -10, 10};
    RooRealVar mu{"mu", "mu", 0.0, -10, 10};
    RooRealVar sigma{"sigma", "sigma", 2.0, 0.1, 10};
    RooGaussian gauss{"gauss", "gauss", xShifted, mu, sigma};
    return std::unique_ptr<RooDataHist>{gauss.generateBinned(xShifted, 10000)};
}

void demo()
{
    using namespace RooFit;

    // Observable "x"
    RooRealVar x{"x", "x", 0.0, -10, 10};

    // The shift will be a fit parameter
    RooRealVar shift{"shift", "shift", 5.0, -10, 10}; // shift by 5 to the left

    // Using RooLinearVar is the key here
    RooLinearVar xShifted{"x_shifted", "x_shifted", x, RooConst(1.0), shift};

    // Create the template RooHistPdf
    std::unique_ptr<RooDataHist> dataHist = createDataHist();
    RooHistPdf histPdf{"histPdf", "histPdf", xShifted, *dataHist};

    // Just to check that it works
    auto xframe = x.frame();
    histPdf.plotOn(xframe);
    xframe->Draw();
}

The RooLinearVar is not so much used and tested though, so expect some rough edges. If you encounter some, please follow up here, or it it is a bug, head over to the GitHub issues and open a bug report :slight_smile:

I hope that helps!

Cheers,
Jonas

@jonas i Just saw this by accident. Why does one should prefer a RooLinearVar rather than a RooFormulaVar?
In the past to obtain a shifted rookeypdf from an input dataset i used the rooformulaVar . Just curious to understand why one prefer here the LinearVar to a FormulaVar.

1 Like

Hi @RENATO_QUAGLIANI,

thanks for your post! Indeed it would be better to use a RooFormulaVar, because the RooLinearVar is not battle-tested so much. I just thought that it’s not possible to use non-fundamental variables in the specific case of the RooHistPdf.

But I remember now that this is not true! There is a RooHistPdf constructor that allows you to specify PDF variables and RooDataHist variables separately, so you should use that one. The code would look somewhat like this:

// Helper function to create the RooDataHist for the template shape
std::unique_ptr<RooDataHist> createDataHist()
{
    RooRealVar x{"x", "x", 0.0, -10, 10};
    RooRealVar mu{"mu", "mu", 0.0, -10, 10};
    RooRealVar sigma{"sigma", "sigma", 2.0, 0.1, 10};
    RooGaussian gauss{"gauss", "gauss", x, mu, sigma};
    return std::unique_ptr<RooDataHist>{gauss.generateBinned(x, 10000)};
}

void demo2()
{
    using namespace RooFit;

    // Observable "x"
    RooRealVar x{"x", "x", 0.0, -10, 10};

    // The shift will be a fit parameter
    RooRealVar shift{"shift", "shift", 5.0, -10, 10}; // shift by 5 to the left

    // The shifted variable is represetned by a RooFormulaVar
    RooFormulaVar xShifted{"x_shifted", "x + shift", {x, shift}};

    // Create the template RooHistPdf
    std::unique_ptr<RooDataHist> dataHist = createDataHist();
    RooHistPdf histPdf{"histPdf", "histPdf", xShifted, x, *dataHist};

    // Just to check that it works
    auto xframe = x.frame();
    histPdf.plotOn(xframe);
    xframe->Draw();
}

Cheers,
Jonas

1 Like

@Jonas Thanks for your help!
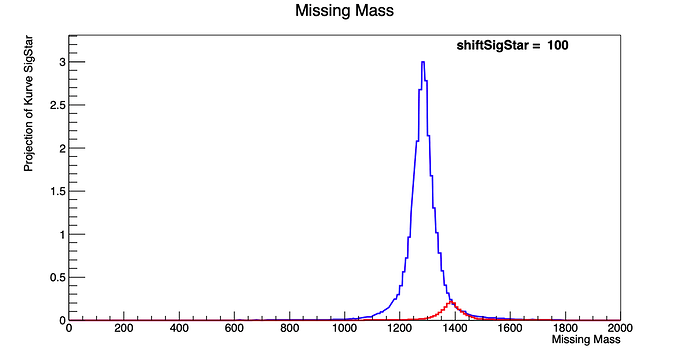
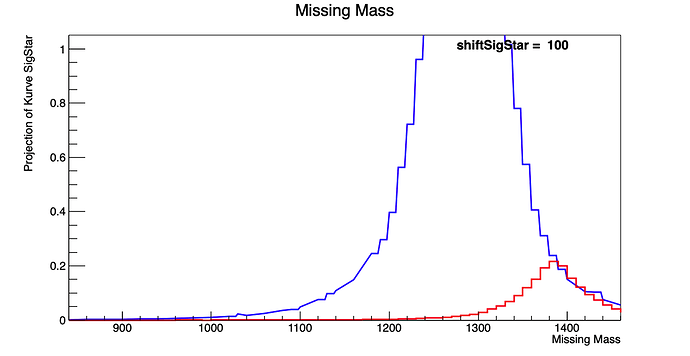
I have been experimenting with the proposed way (which in general seems to be my solution). However it affects the line shape in a way I do not understand. As an example here are pictures of the original pdf (red) and the shifted pdf (blue).


Does anyone know what has gone wrong?
Here is my code, if that helps:

RooRealVar mass("Mass","Missing Mass",0,2000);
RooPlot *Massframe = mass.frame(Title(TString("Missing Mass")));
TFile *g=TFile::Open("../Data/KPlusSigmaStar.root");
TString* HistPost = new TString("FittedTrack_BeamEnergyVsMissingMassKaonPlusBE");
TH2* HistSigStar2 = (TH2*) g->FindObjectAny(*HistPost);
 
TH1* HistSigStar = (TH1*) HistSigStar2->ProjectionX(TString("SigStar_"),1,119)->Rebin(5,0);
RooRealVar shiftSigStar("shiftSigStar","Shift of SigStar",100.0,-1000,1000.0);
RooFormulaVar MassShifted("MassShift","Mass + shiftSigStar",RooArgList(mass,shiftSigStar));
RooDataHist SimSigStar("SimSigStar","Simulation of SigStar",mass,Import(*(HistSigStar)));
RooHistPdf* CurveSigStar = new RooHistPdf("CurveSigStar","Kurve SigStar",MassShifted,mass,SimSigStar);
RooHistPdf* CurveSigStarNorm = new RooHistPdf("CurveSigStar","Kurve SigStar",mass,SimSigStar);
CurveSigStar->plotOn(Massframe);
CurveSigStar->paramOn(Massframe);
CurveSigStarNorm->plotOn(Massframe, LineColor(kRed));
CurveSigStarNorm->paramOn(Massframe);
Massframe->Draw();

Thanks,
Emil

@Jonas just to make sure I also tried your code, which seems fine for the generated data. But as soon as I use my data in your code, it gets slightly distorted. That does not seem to matter at first, but somehow the fitting is not possible with these distorted shapes.
Thanks,
Emil