I want to set up a situation like this ,when the proton beam pass through the position gas ionization chamber, according the signal information collected by the copper strips in the X and Y direction, then finally get the distribution of the beam spots almost like the plot in the below. How should I do.
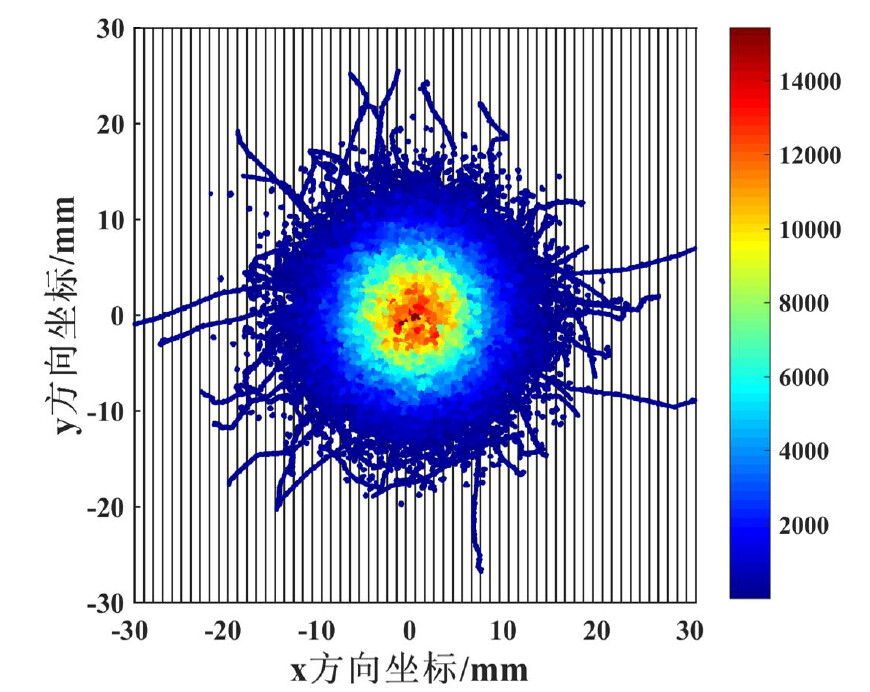
What exactly is plotted in this histogram?
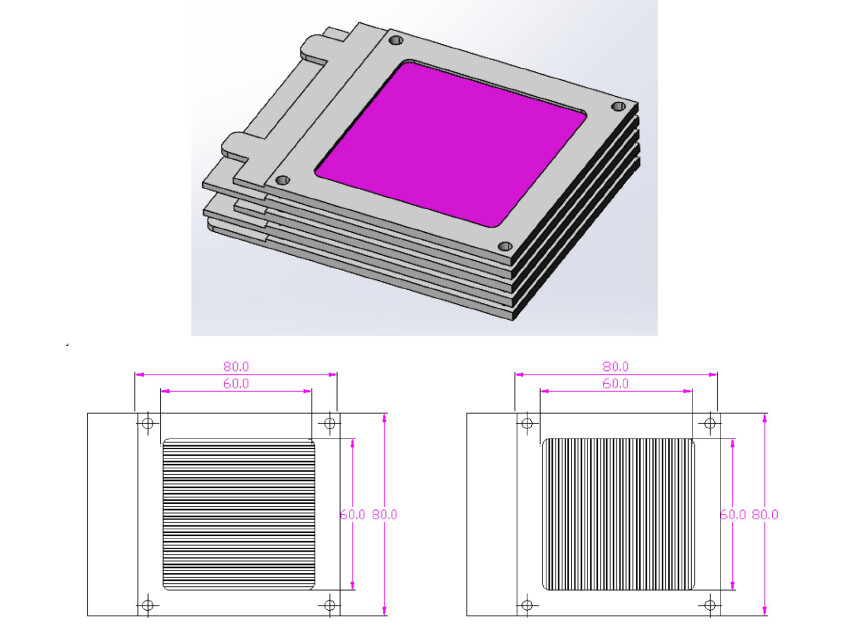
It’s about the situation that when the proton beam passing through a position gas ionization chamber including X direction and Y direction copper strip as the electron collector like the plot below. while the coordinate information of the electrons collected in the copper strip on the two directions would be generated a distribution, I think it to be the beam spot, which can show the position information about the proton beam.
I guess @hschindl can help you.
It is just like when a electron passing through the X position plate would have a coordinate in the X direction, while the same as the Y position plate. Put the X coordinate and Y coordinate information together in one plot ,then we can get the specific position information of the electron as well as the whole distribution.