Dear experts,
I have a data set as shown in the figure below. I would like to create a 3D fit on it.
Could you please advise me how to do it? What distribution should I use?
Thank you very much,
Zaga
plot.root (53.7 KB)
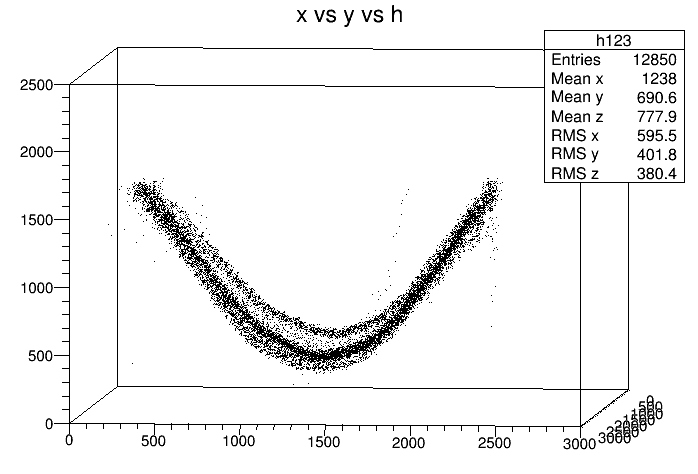
Dear experts,
I have a data set as shown in the figure below. I would like to create a 3D fit on it.
Could you please advise me how to do it? What distribution should I use?
Thank you very much,
Zaga
plot.root (53.7 KB)
You could have a look at the TF3 class.
I think usually you either have theoretical motivations for using certain forms for your distributions or you just throw the usual ones at it (multivariates, paraboloids) and see what gives the best fit.
Thank you for your replies.
I have just started working in ROOT.
Could you please point me to an example of fitting dots in 3D,
(something similar to my example)?
I was thinking of trying a polynomial fit.
Thank you. 
For info: the new presentation of the example is here:
https://root.cern/doc/master/exampleFit3D_8C.html
The macro has been executed and the output is shown.
This topic was automatically closed 14 days after the last reply. New replies are no longer allowed.