There are nearly sixty copper strips in the gas ionization chamber in both X and Y directions. How should I get the accurate coordinates of the electrons collected on them for the purpose of knowing the distribution of the proton beam. How about the GetEndPoint()?
I guess @hschindl can help you.
You can loop over the electrons in the avalanche and retrieve the coordinates of the end points like this:
for (const auto& electron : aval.GetElectrons()) {
  const auto& endPoint = electron.path.back();
  std::cout << "End point: " << endPoint.x << ", " << endPoint.y << ", " << endPoint.z << "\n";
}
You need to update (“git pull”) to a recent version of the code.
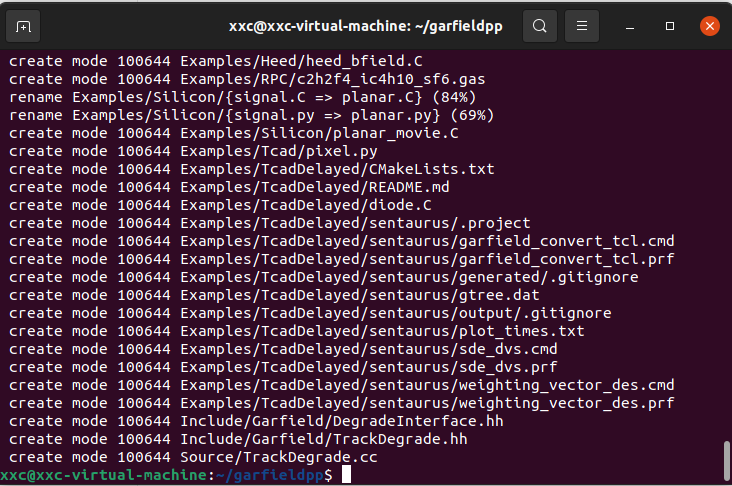
Sorry for being unclear. You also need to rebuild (go to the $GARFIELD_HOME/build folder, and to cmake ..; make; make install).
The snippet of code I sent you was just an illustration of how to retrieve the coordinates of the end points of the electron trajectories. If you want to show their distribution, you will need to create a histogram and fill it with these coordinates.
Hi
Thanks a lot for your reply and kindly help
I have seen some examples about create a histogram and fill it, this is my code below
AvalancheMicroscopic aval;
  aval.SetSensor(&sensor);
  aval.SetCollisionSteps(100000);
  for (const auto& electron : aval.GetElectrons()) {
  const auto& endPoint = electron.path.back();
  std::cout << "End point: " << endPoint.x << ", " << endPoint.y << ", " << endPoint.z << "\n";
  }

  // Histograms
  TH1::StatOverflows(true);
  TH1F hElectrons("hElectrons", "Avalanche Size", 200, 0, 2000);
  TH1F hElectronsnumber("hElectrons", "Number of electrons", 200, 0, 200);
  TH1F hIons("hIons", "Avalanche Size", 200, 0, 2000);
  TH1F hEnergy("hEnergy", "Energy Distribution", 500, 0., 50.);
  // Request the electron energy histogram to be filled.
  aval.EnableElectronEnergyHistogramming(&hEnergy);
  aval.EnableElectronEnergyHistogramming(&hElectrons);
  aval.EnableElectronEnergyHistogramming(&hElectronsnumber);
  aval.EnableElectronEnergyHistogramming(&hIons);
  std::cout << "Energy Distribution" << " kV/cm\n";
  std::cout << "Avalanche Size for Electrons" << " mm";
  std::cout << "Number of electrons" << " ";
  std::cout << "Avalanche Size for Ion" << " mm";
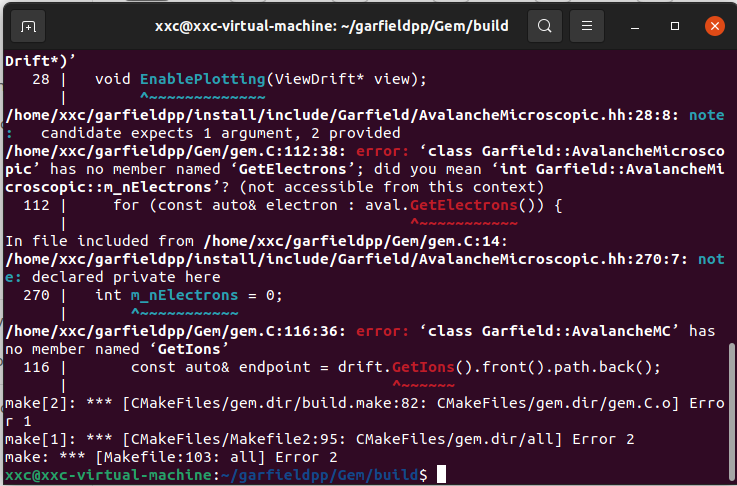
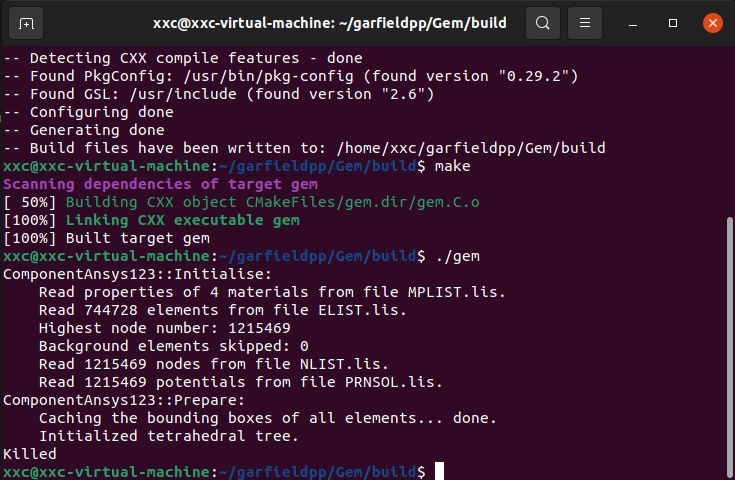
But when I run the code, the screen will like this and last for a long time with no results, and even the computer could not work anymore
Hi, Sorry for bothering you, I don’t know how to create a histogram and fill it with these coordinates, I tried many ways according to the examples, while when I run the code, the program would be stuck.
Here is a simple example, you’ll need to adapt it to your needs.
AvalancheMicroscopic aval;
aval.SetSensor(&sensor);

// Create a 2D histogram with 100 bins between -1. and 1. (same range and binning for x and y).
TH2F hHitMap("hHitMap", "Hit map", 100, -1., 1., 100, -1., 1.);

// Simulate one electron avalanche starting from (0, 0, 0).
double x0 = 0., y0 = 0., z0 = 0., t0 = 0.;
// Set the kinetic energy of the initial electron to 0.1 eV
double e0 = 0.1;
aval.AvalancheElectron(x0, y0, z0, t0, e0);
for (const auto& electron : aval.GetElectrons()) {
  const auto& endPoint = electron.path.back();
  hHitMap.Fill(endPoint.x, endPoint.y);
}

TCanvas c1;
hHitMap.Draw("colz");
I don’t know why is the that. Here is the complete code
// multiple tracks and calculate the average collected charge
#include <iostream>
#include <TApplication.h>
#include <TH1F.h>
#include <TCanvas.h>
#include "Garfield/MediumSilicon.hh"
#include "Garfield/ComponentConstant.hh"
#include "Garfield/Sensor.hh"
#include "Garfield/TrackTrim.hh"
#include "Garfield/DriftLineRKF.hh"
#include "Garfield/ViewDrift.hh"
#include "Garfield/ViewSignal.hh"
#include "Garfield/ComponentAnsys123.hh"
#include "Garfield/MediumMagboltz.hh"
#include "Garfield/ViewField.hh"
#include "Garfield/TrackHeed.hh"
#include "Garfield/ViewMedium.hh"
#include "Garfield/AvalancheMicroscopic.hh"
#include "Garfield/AvalancheMC.hh"
using namespace Garfield;
int main(int argc, char *argv[]) {
// Application
TApplication app("app", &argc, argv);
ComponentAnsys123 fm;
fm.Initialise("ELIST.lis", "NLIST.lis", "MPLIST.lis", "PRNSOL.lis", "m");
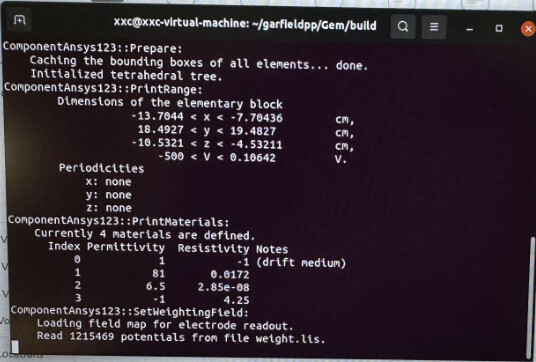
fm.PrintRange();
fm.PrintMaterials();
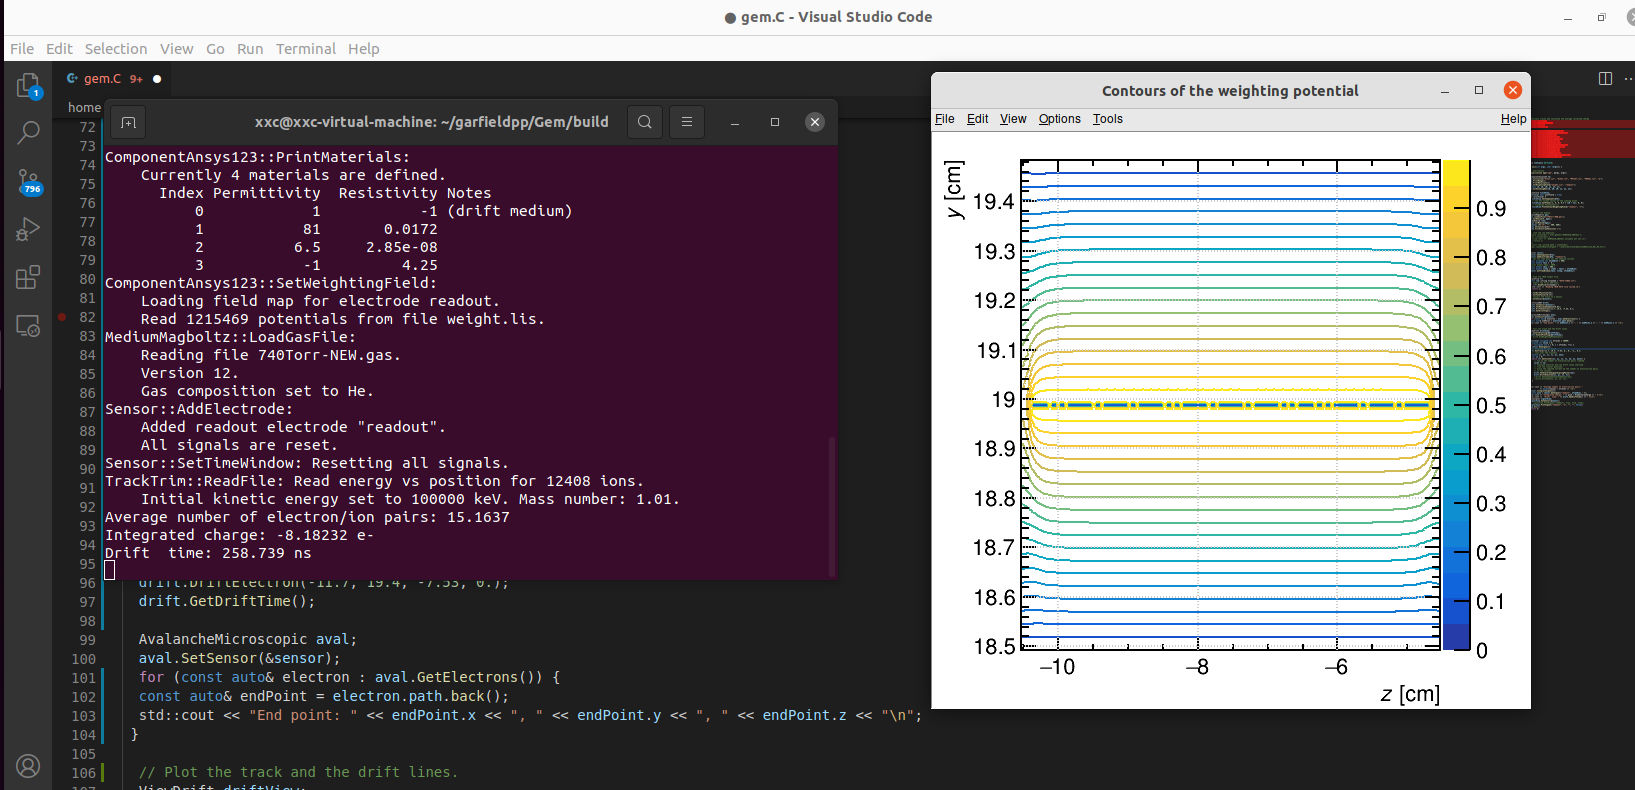
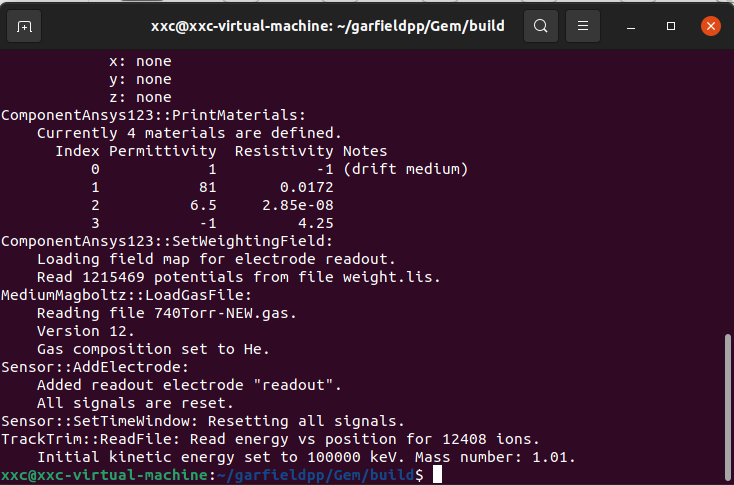
fm.SetWeightingField("weight.lis", "readout");
double x0, y0, z0, x1, y1, z1;
fm.GetBoundingBox(x0, y0, z0, x1, y1, z1);
ViewField fieldView;
constexpr bool plotField = true;
if (plotField) {
fieldView.SetComponent(&fm);
// Set the normal vector of the viewing plane.
fieldView.SetPlane(-1, 0, 0, 0.5 * (x0 + x1), 0, 0);
// fieldView.PlotContour();
fieldView.PlotContourWeightingField("readout", "v");
}
// Define the medium.
MediumMagboltz gas;
gas.LoadGasFile("740Torr-NEW.gas");
fm.SetMedium(0, &gas);
ViewMedium view;
view.SetMedium(&gas);
TCanvas cV("cV", "", 600, 600);
view.SetCanvas(&cV);
view.PlotElectronVelocity('e');
// Load the ion mobility.
//auto installdir = std::getenv("GARFIELD_INSTALL");
//if (!installdir) {
//std::cerr << "GARFIELD_INSTALL variable not set.\n";
//return 1;
//}
//const std::string path = installdir;
//gas.LoadIonMobility(path + "/share/Garfield/Data/IonMobility_He+_He.txt");
Sensor sensor;
sensor.AddComponent(&fm);
sensor.AddElectrode(&fm, "readout");
// Set the time bins for the induced current.
const unsigned int nTimeBins = 800;
const double tmin = 0.;
//onst double tmax = 2000.;
const double tmax = 800.;
const double tstep = (tmax - tmin) / nTimeBins;
sensor.SetTimeWindow(tmin, tstep, nTimeBins);
// Read the TRIM output file.
TrackTrim tr;
const std::string filename = "EXYZ-740He.txt";
// Import the first 100 ions.
if (!tr.ReadFile(filename)) {
std::cerr << "Reading TRIM EXYZ file failed.\n";
return 1;
}
tr.SetWorkFunction(42);
tr.SetFanoFactor(0.17);
// Connect the track to a sensor.
tr.SetSensor(&sensor);
DriftLineRKF drift;
drift.SetSensor(&sensor);
drift.SetMaximumStepSize(0.01);
drift.DriftElectron(-11.7, 19.4, -7.53, 0.);
drift.GetDriftTime();
AvalancheMicroscopic aval;
aval.SetSensor(&sensor);
// Create a 2D histogram with 100 bins between -1. and 1. (same range and binning for x and y).
TH1F hHitMap("hHitMap", "Hit map", 100, -14., -6.);
// Simulate one electron avalanche starting from
double x2 = -11.7, y2 = 19.2, z2 = -7.53, t2 = 0.;
// Set the kinetic energy of the initial electron to 0.1 eV
double e2 = 0.1;
aval.AvalancheElectron(x2, y2, z2, t2, e2);
for (const auto& electron : aval.GetElectrons()) {
const auto& endPoint = electron.path.back();
hHitMap.Fill(endPoint.x, endPoint.y);
}
TCanvas c1;
hHitMap.Draw("colz");
// Plot the track and the drift lines.
ViewDrift driftView;
tr.EnablePlotting(&driftView);
drift.EnablePlotting(&driftView);
// drift.UseWeightingPotential();
constexpr unsigned int nTracks = 10000;
unsigned int nesum = 0;
for (unsigned int i = 0; i < nTracks; ++i) {
sensor.NewSignal();
// Simulate an ion track.
tr.NewTrack(-11.7, 19.4, -7.53, 0., 0., -1., 0.);
// Loop over the clusters.
double xc, yc, zc, tc, ec, ekin;
int ne = 0;
while (tr.GetCluster(xc, yc, zc, tc, ne, ec, ekin)) {
// Sum up the number of electron/ion pairs created.
nesum += ne;
// Simulate electron and ion drift lines starting
// from the cluster position.
// Scale the induced current by the number of electron/ion pairs
// in the cluster.
drift.SetElectronSignalScalingFactor(ne);
drift.DriftElectron(xc, yc, zc, tc);
//drift.SetIonSignalScalingFactor(ne);
//drift.DriftIon(xc, yc, zc, tc);
}
}
std::cout << "Average number of electron/ion pairs: "
<< double(nesum) / nTracks << "\n";
sensor.IntegrateSignals();
double qsum = sensor.GetSignal("readout", nTimeBins - 1);
std::cout << "Integrated charge: " << qsum / ElementaryCharge << " e-\n";
std::cout << "Drift time: " << drift.GetDriftTime() << " ns\n";
ViewSignal signalView;
signalView.SetSensor(&sensor);
// signalView.PlotSignal("readout", true, true, true);
signalView.PlotSignal("readout", "t", "", "", false);
app.Run();
return 0;
}
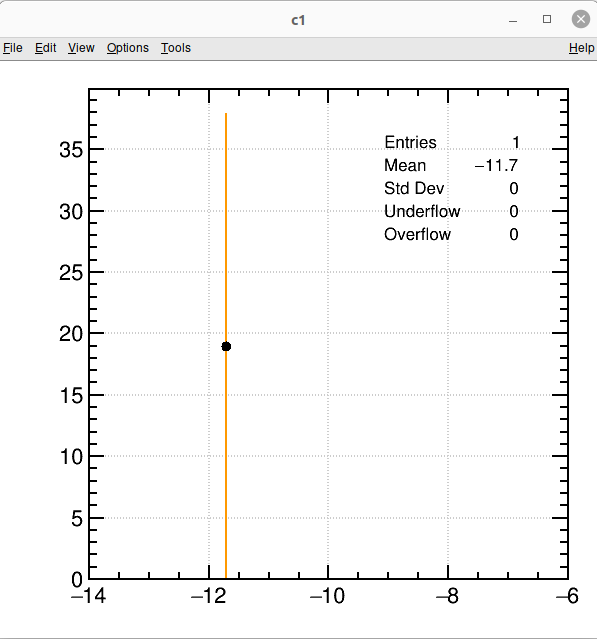
There are a few issues with the program you sent.
- You simulate only one electron avalanche (
aval.AvalancheElectron(...);). I suspect that you have no multiplication in your detector, so there is only one electron trajectory and hence only one entry in your histogram. Is this what you meant to do? - You create a 1D histogram (
TH1F) but then fill it like a 2D histogram.
Hi,
Thanks a lot for your reply
I want to simulate all the electron trajectory but not only one entry, I have change the code like this
AvalancheMicroscopic aval;
aval.SetSensor(&sensor);
// Create a 2D histogram with 100 bins between -1. and 1. (same range and binning for x and y).
TH1F hHitMap("hHitMap", "Hit map", 100, -14., -6., 100, 18., 20.);
constexpr unsigned int npe = 50;
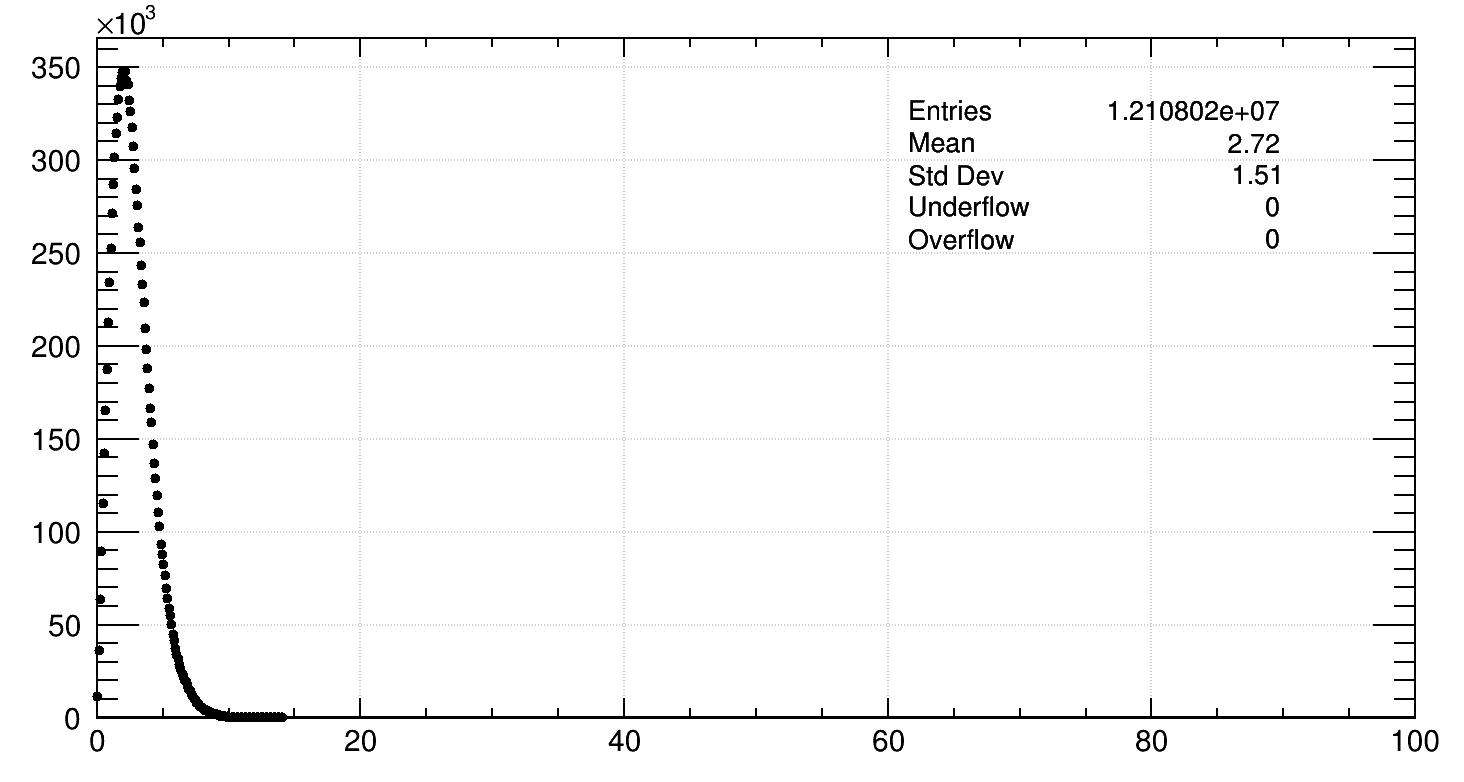
// Make a histogram of the electron energy distribution.
TH1D hEn("hEn","energy distribution", 1000, 0., 100.);
aval.EnableElectronEnergyHistogramming(&hEn);
constexpr bool print = false;
std::vector<unsigned int> nVUV;
// Calculate a few avalanches.
for (unsigned int i = 0; i < npe; ++i) {
// Release the primary electron 0.2 cm away from the bottom electrode.
const double x0 = -11.7;
const double y0 = 19.2;
const double z0 = -7.53;
const double t0 = 0.;
// Draw the initial energy [eV] from the energy distribution.
const double e0 = i == 0 ? 1. : hEn.GetRandom();
std::cout << "Avalanche "<< i + 1 << " of " << npe << ".\n";
if (print) {
std::cout << " Primary electron starts at (x, y, z) = ("
<< x0 << ", " << y0 << ", " << z0
<< ") with an energy of " << e0 << " eV.\n";
}
// Simulate the avalanche
aval.AvalancheElectron(x0, y0, z0, t0, e0, 0, 0, 0);
for (const auto& electron : aval.GetElectrons()) {
const auto& endPoint = electron.path.back();
hHitMap.Fill(endPoint.x, endPoint.y);
}
}
TCanvas c1;
hHitMap.Draw("coordinate");
TCanvas c2;
hEn.Draw("energy");
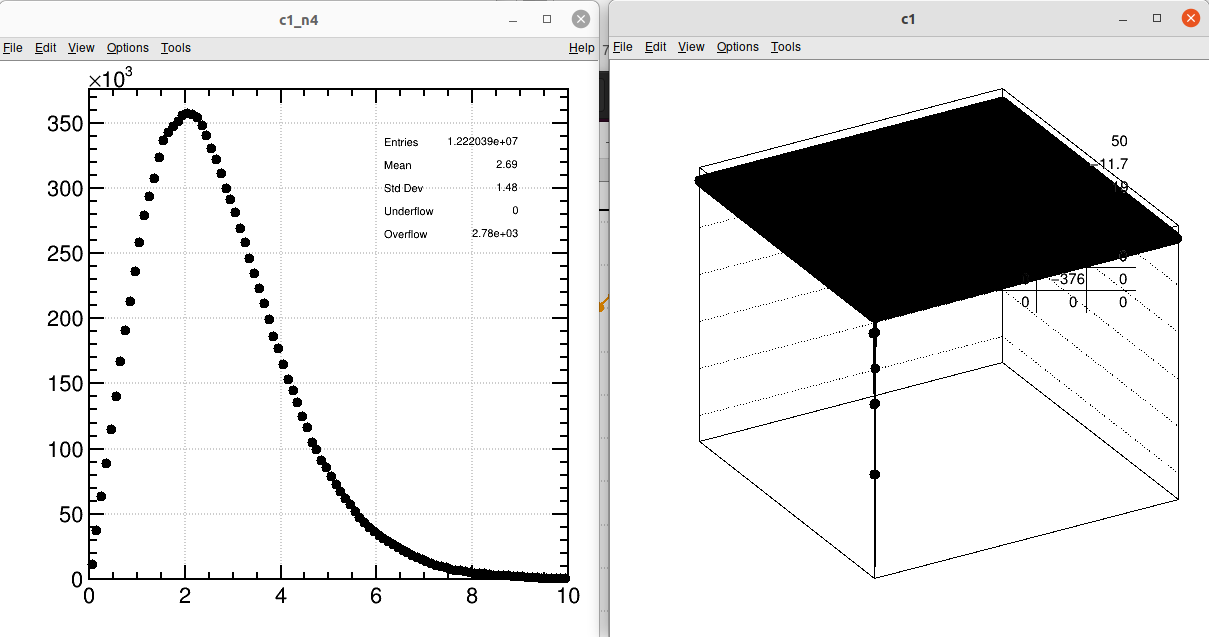
How ever the result is like this
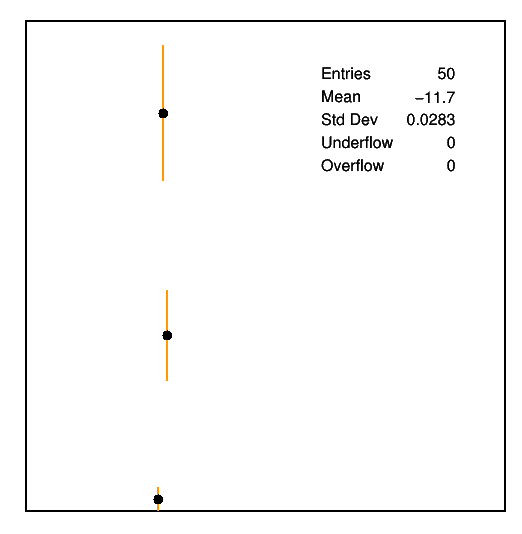
which is not the one I expected.
As what you said the TH1F, I really don’t know what’s the difference among the TH1F, TH2F and TH1D
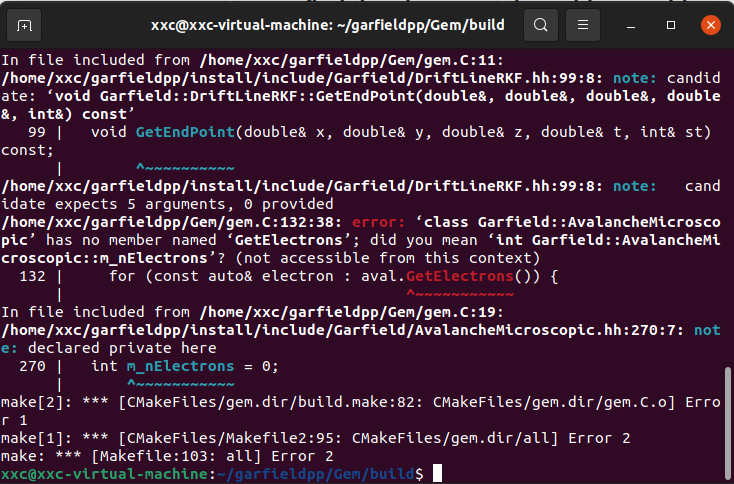
When I use the TH2F as your told me, the error would be like this:
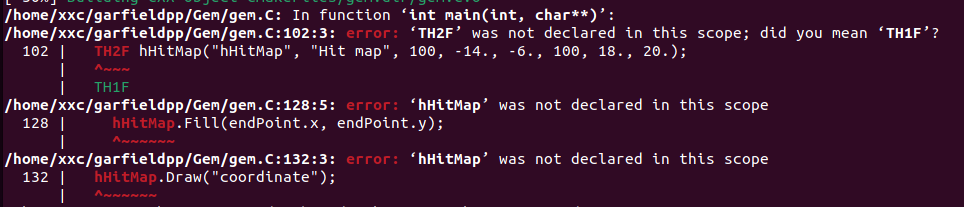
To be able to use a TH2F in your program, you need to add a line
#include <TH2F.h>
to the include statements at the beginning of the program. For an explanation of the different histogram classes, have a look at the ROOT documentation:
I’m still unclear about what you want to do. In the modified program you simulate 50 “primary” electrons but they all start from the same point. Is this what you want? I thought you wanted to simulate drift lines from a particle track?