I have TH2F histograms, drawn with (“scat”) options.
I can plot them at various variable intervals. I drew those histograms in the same canvas to see how they shift, as I choose different variable intervals.
My problem is that, it is hard to see the shift. “SCAT” option looks just too nasty and I cannot distinguish anything. What option should I use to illustrate the shift of histograms more clearly? I tried “box” and “cont1,” they are not any better.
Is there any way to draw histograms without contour, or count color distinctions–just plain one solid color for the first hist, and different for the next, etc?
Maybe is there any other way of representing these data other than TH2F hists?
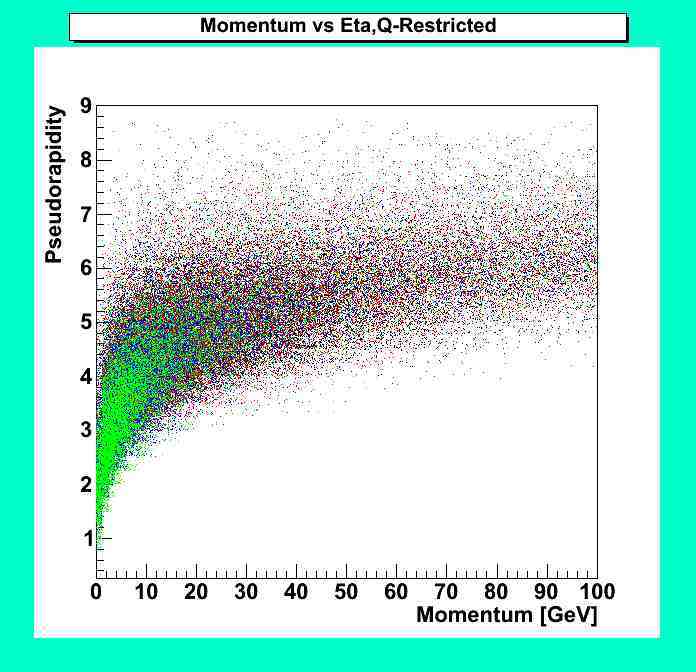
I attached my sample plots. I have to improve them.
Thank you.
Tuya