Dear Expert,
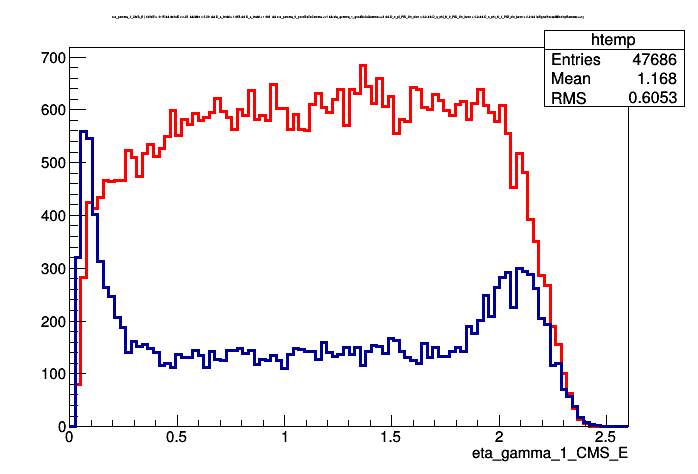
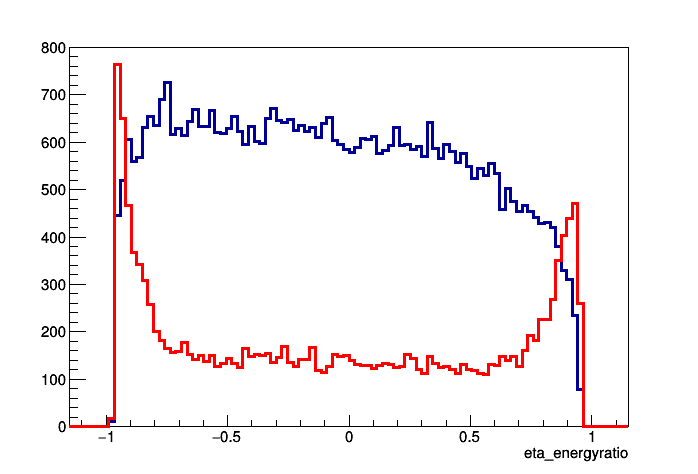
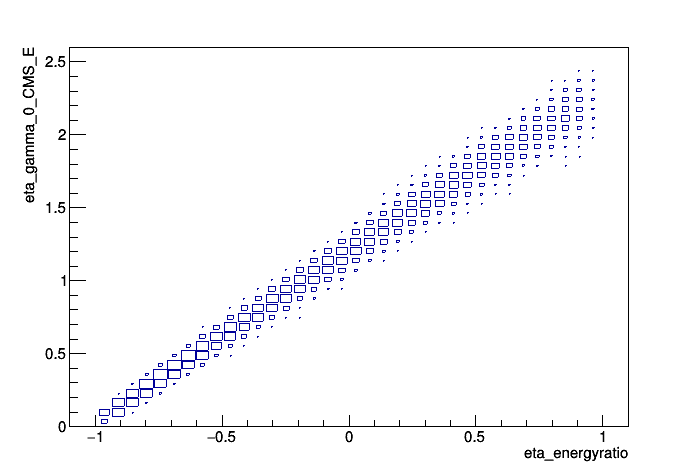
I plotted the 1D distribution of photon energy and asymmetry energy ratio. Both are strongly correlated. But I want to draw the optimization of 2D distribution between both variables. I also attached the 1D distribution of photon energy (energy_gamma_both.png), asymmetry energy (asyenergy_gamma_both) and correlated distribution (2D_energy1_asy.png) below.
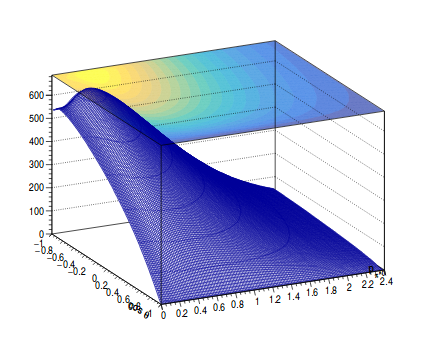
But I want to draw the 2D optimization of both variables the same as shown in sample.png below.
Can you please suggest how can I do this?
Any kind of suggestion and help is highly appreciated.
Regards
Chanchal
Please read tips for efficient and successful posting and posting code
ROOT Version: Not Provided
Platform: Not Provided
Compiler: Not Provided