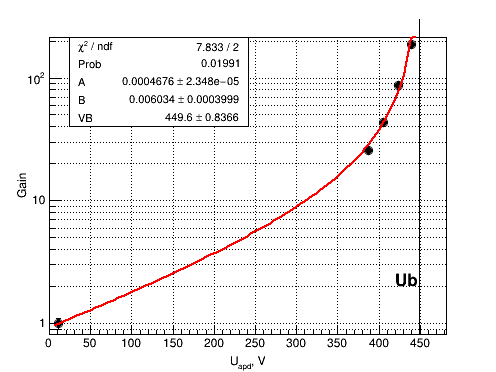
I want to draw a vertical line on my graph. But this:
mgr->GetXaxis()->SetTitle("U_{apd}, V");
  mgr->GetXaxis()->CenterTitle();
  mgr->GetXaxis()->SetTitleOffset(1.4);
  mgr->GetYaxis()->SetTitle("Gain");
  mgr->GetYaxis()->CenterTitle();
  mgr->Draw("AP");
//Draw vertical line with text at Ub
TLine* l = new TLine(fitpar[2], 0, fitpar[2], 300);
  l->Draw("same");
TText* ub = new TText();
  ub->DrawText(fitpar[2]-30., 2, "Ub");

c->SetLogy();
c->SetGrid();
provides not very beautiful picture (see Fig.) So how do I know the canvas or graph (which it should be) y-range?
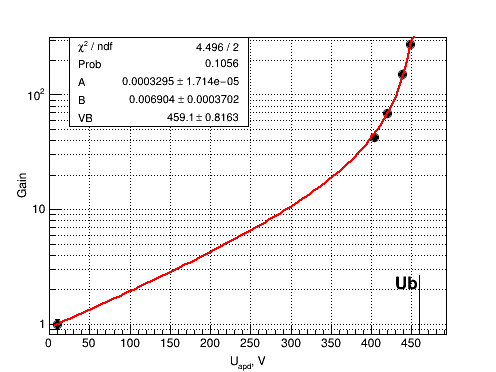
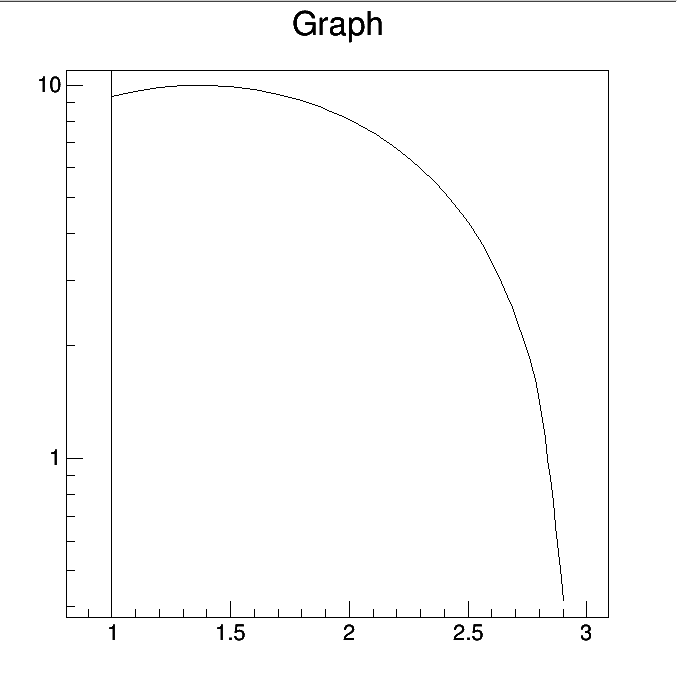
I tried this but do not able to understand the result (see Fig.).
mgr->GetXaxis()->SetTitle("U_{apd}, V");
  mgr->GetXaxis()->CenterTitle();
  mgr->GetXaxis()->SetTitleOffset(1.4);
  mgr->GetYaxis()->SetTitle("Gain");
  mgr->GetYaxis()->CenterTitle();
  mgr->Draw("AP");

c->SetLogy();
c->SetGrid();

//Draw vertical line with text at Ub
TLine* l = new TLine(fitpar[2], 0, fitpar[2], c->GetY2());
  l->Draw("same");
TText* ub = new TText();
  ub->DrawText(fitpar[2]-30., 2, "Ub");
Sorry, guys. I did not mention that this part of code are in the loop. So I should turn off log-scale after each iteration before the next. How to do this? I tried SetLogy(kFALSE) but it does not seem to work.
Can you send a short running reproducer of your problem ?
You only sent pieces of code … that’s hard to debug… Send something with the full logic. Not necessarily the original code (which might be too long) but a small macro rerproducing the effect. Thanks