ROOT Version: 5.34.34 Platform: Mac Compiler: Not Provided
Hi experts
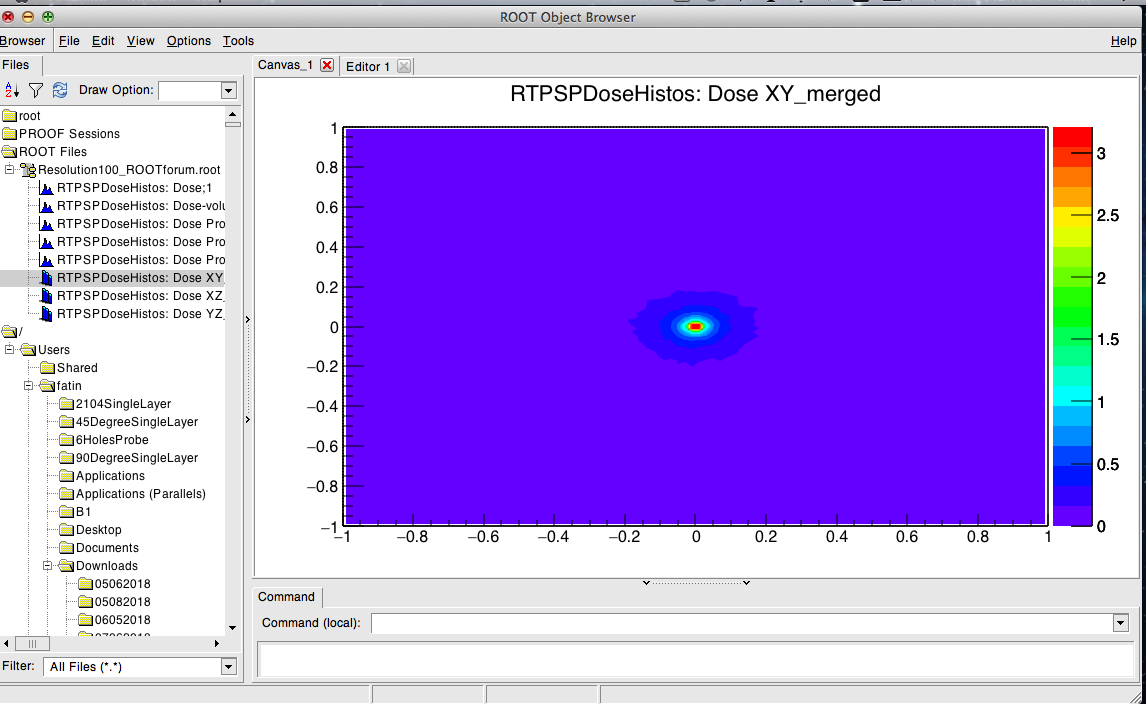
Referring to the attached file, I would like to know how to draw a solid round shape instead of rectangular. I did increase the resolution, but resulted the same.RootForum.pdf (97.2 KB)
I did increase the resolution, but still got the similar situation. Moreover, the outer shape of the increase resolution to 100 is not as round as before when the resolution was 50 (refer to the attached file).
Actually I did the simulation in GAMOS/Geant4 and the results of 2D histogram were converted to .root files. I also attached here the .root files of both resolutions as well as .txt files. Resolution50_ROOTforum.root (26.9 KB) Different resolution.pdf (63.9 KB) Resolution100_ROOTforum.root (77.2 KB) Resolution50_ROOT_textfile.txt (159.9 KB) Resolution100_ROOT_textfile.txt (614.9 KB)
Which histogram I should look at ? (Note your histograms have blank spaces in their names, which makes them more difficult to access)
Can you also provide a macro showing how you actually plot the histogram (options etc …).
Hi, Sorry for the late reply. I was away for something before.
Regarding the histogram, it is actually RTPSPDoseHistos: Dose XY_merged. (I am really sorry for the confusing). Can you get access?
Regarding the macro, I actually run the simulation in GEANT4/GAMOS and then the .root file is produced at the end of the simulation. The picture of the 2D histogram is got via GUI. I think has been coded by the developers of GEANT4/GAMOS.
$ root Resolution100_ROOTforum.root
   --------------------------------------------------------------------
  | Welcome to ROOT 6.15/01                          https://root.cern |
  |                                       (c) 1995-2018, The ROOT Team |
  | Built for macosx64                                                 |
  | From heads/master@v6-13-04-1259-g1dabb6926c, Sep 18 2018, 15:03:52 |
  | Try '.help', '.demo', '.license', '.credits', '.quit'/'.q'         |
   --------------------------------------------------------------------

root [0]
Attaching file Resolution100_ROOTforum.root as _file0...
(TFile *) 0x7fbd15c564d0
root [1] TH2F *h = (TH2F*)_file0->Get("RTPSPDoseHistos: Dose XY_merged")
(TH2F *) 0x7fbd16875a00
root [2] h->Draw("cont")
Info in <TCanvas::MakeDefCanvas>:  created default TCanvas with name c1
root [3] h->Draw("cont4")
root [4] h->Draw("col")
The 3 options I used in this example are the only ones close to what you want. If you need more precision increase the number of bins along X and Y … there is nothing more I can offer I am afraid.
Hi, Can you show me the histogram, for me to compare with mine?
I cannot use your command on;
root [2] h->Draw(“cont”)
Info in TCanvas::MakeDefCanvas: created default TCanvas with name c1
root [3] h->Draw(“cont4”)
root [4] h->Draw(“col”)
Instead, I use;
root [4] new TBrowser
(class TBrowser*)0x7fc083a16fe0