How to draw a line at some specific value of cross-section at x-axis having a color region showing uncertainties ?
I am new so i can’t be able to add picture of graph.if anyone know please help me.
Thanks
The simplest way to draw is line is to use TLine.
do you have a code or can you please guide me how to use TLine
thanks
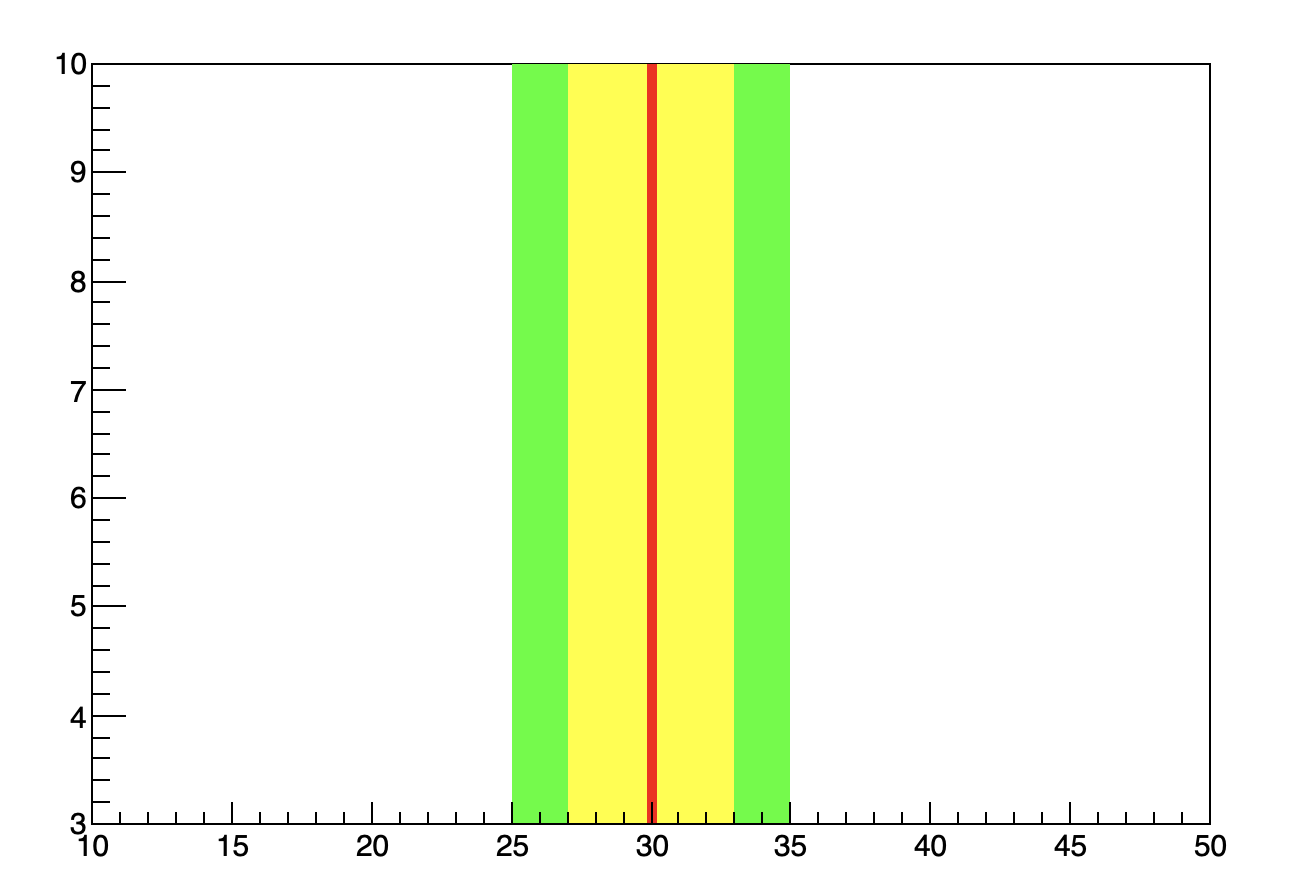
can i make line only without this graph and also can color differenly in the area between lets say inbetween 27 and 30.

{
   auto c = new TCanvas();
   c->DrawFrame(10., 3., 50., 10);

   gPad->Update();
   auto b1 = new TBox(25,gPad->GetUymin(),35,gPad->GetUymax());
   b1->SetFillColor(kGreen);
   b1->SetFillStyle(1001);
   b1->Draw();

   auto b2 = new TBox(27,gPad->GetUymin(),33,gPad->GetUymax());
   b2->SetFillColor(kYellow);
   b2->SetFillStyle(1001);
   b2->Draw();

   auto l = new TLine(30,gPad->GetUymin(),30,gPad->GetUymax());
   l->SetLineColor(kRed);
   l->SetLineWidth(5);
   l->Draw();

   c->RedrawAxis();
}
should i use error graph for cross-sections as shown?
Yes, for instance.
Then you simply draw them just before RedrawAxis
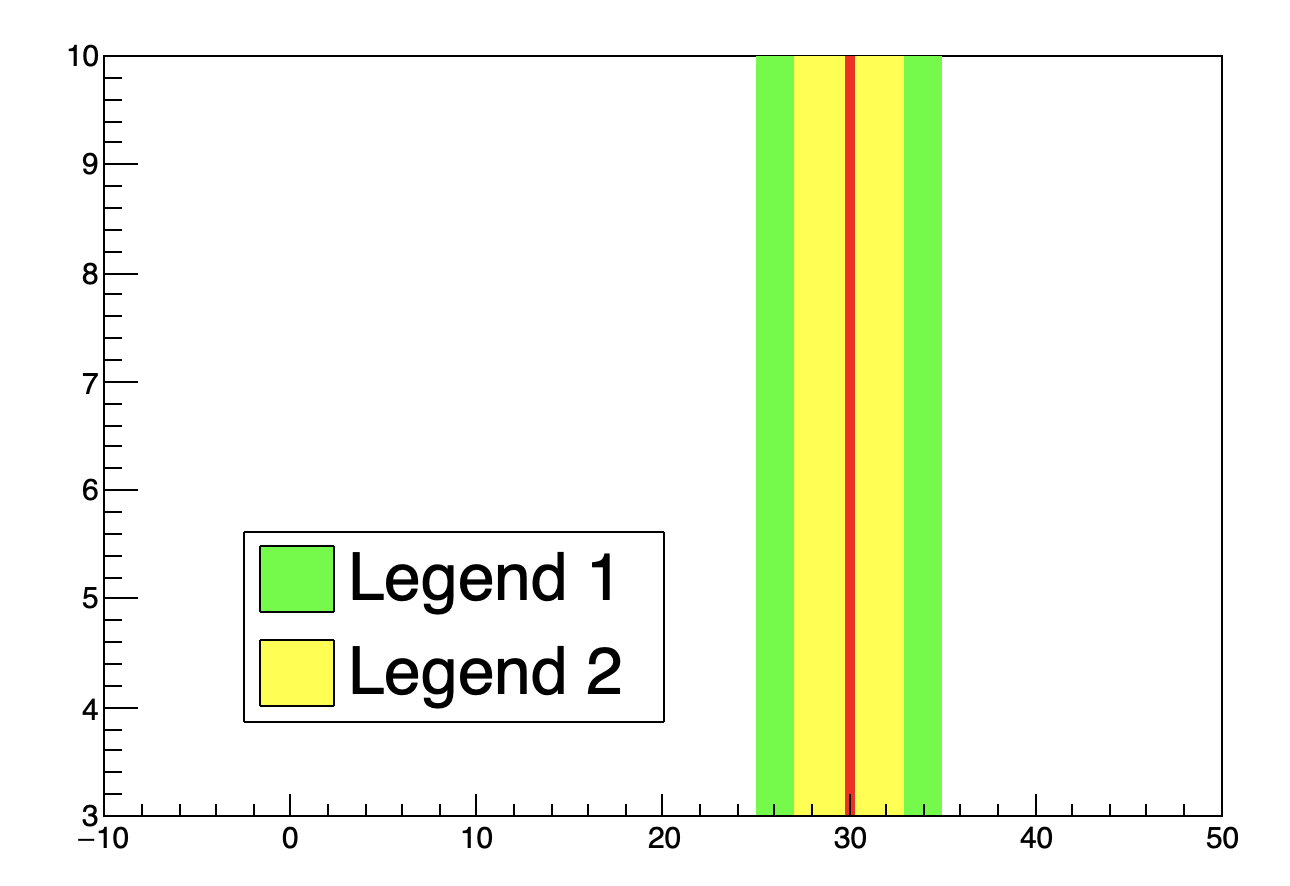
Please also tell me how to draw these legends for color and line.
Thanks
{
   auto c = new TCanvas();
   c->DrawFrame(-10., 3., 50., 10);

   gPad->Update();
   auto b1 = new TBox(25,gPad->GetUymin(),35,gPad->GetUymax());
   b1->SetFillColor(kGreen);
   b1->SetFillStyle(1001);
   b1->Draw();

   auto b2 = new TBox(27,gPad->GetUymin(),33,gPad->GetUymax());
   b2->SetFillColor(kYellow);
   b2->SetFillStyle(1001);
   b2->Draw();

   auto l = new TLine(30,gPad->GetUymin(),30,gPad->GetUymax());
   l->SetLineColor(kRed);
   l->SetLineWidth(5);
   l->Draw();

   auto *leg = new TLegend(0.2, 0.2, 0.5, 0.4);
   leg->AddEntry(b1,"Legend 1","F");
   leg->AddEntry(b2,"Legend 2","F");
   leg->Draw();
   c->RedrawAxis();
}
May be ask your colleagues to provide you this macro ? it will be simpler.

waiting for any suggestions please
In the end, try to add: your_graph->Draw("P");
not working
Attach your macro which creates your plot.
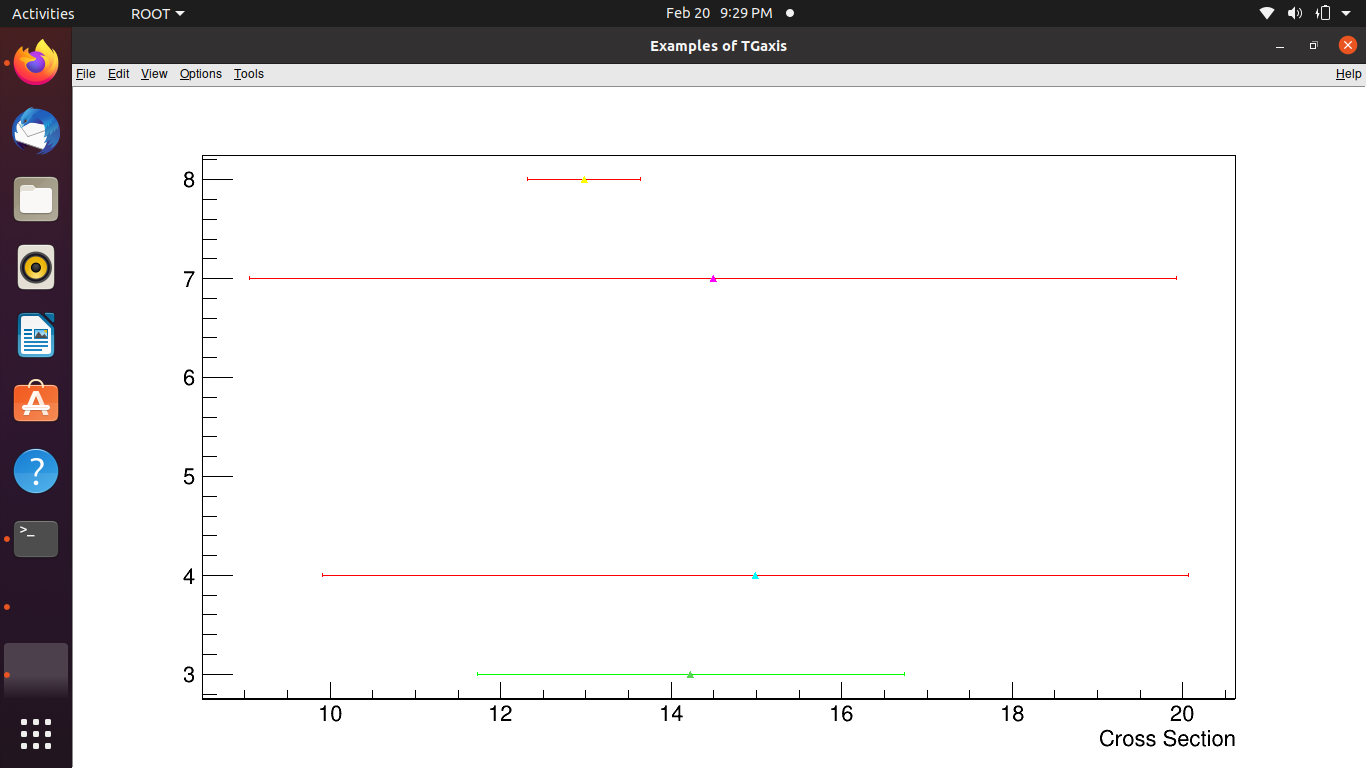
{
TCanvas *c1 = new TCanvas("c1","Examples of TGaxis",10,10,700,500);
c1->Range(-10,-1,10,1);
TGraphErrors *gr =new TGraphErrors();
    gr->SetTitle("Graph");
    gr-> GetXaxis()->SetTitle("alpha");
    gr-> GetYaxis()->SetTitle("Cross Section");
double x , y , ex ,ey;
int n = 0 ;
	n= gr->GetN();//take actual nbr of data file
	gr->SetPoint(0,14.23,3);//for defining the point
	gr->SetPointError(0 ,2.5 ,0);
	gr->SetLineColor(3);
	gr->SetMarkerColor(8);
          gr->SetMarkerStyle(22);
gr->Draw();
 TGraphErrors *gr1 =new TGraphErrors();
    double x1 , y1 , ex1 ,ey1;
    int m = 0 ;
            m= gr1->GetN();//take actual nbr of data file
            gr1->SetPoint(0,14.99,4);//for defining the point
            gr1->SetPointError(0 ,5.08 ,0);
	gr1->SetLineColor(2);
            gr1->SetMarkerColor(7);
          gr1->SetMarkerStyle(22);
    gr1->Draw();
 TGraphErrors *gr2 =new TGraphErrors();
    double x12 , y12 , ex12 ,ey12;
    int p = 0 ;
            p= gr2->GetN();//take actual nbr of data file
            gr2->SetPoint(0,14.49,7);//for defining the point
            gr2->SetPointError(0 ,5.440 ,0);
	gr2->SetLineColor(2);
            gr2->SetMarkerColor(6);
          gr2->SetMarkerStyle(22);
    gr2->Draw();
TGraphErrors *gr3 =new TGraphErrors();
double x122 , y122 , ex122 ,ey122;
int q = 0 ;
q= gr3->GetN();
gr3->SetPoint(0,12.98,8);
gr3->SetPointError(0 ,0.663 ,0);
gr3->SetLineColor(2);
gr3->SetMarkerColor(5);
gr3->SetMarkerStyle(22);
gr3->Draw();
//////////////////////////////////////
TMultiGraph *mg = new TMultiGraph();
mg->Add(gr);
mg->Add(gr1);
mg->Add(gr2);
mg->Add(gr3);
mg-> GetXaxis()->SetTitle(“Cross Section”);
mg->Draw(“P SAME”);
auto b1 = new TBox(9.7953,2.75,12.0046,8.2);
b1->SetFillColor(kGreen);
b1->SetFillStyle(1001);
b1->Draw();
auto l = new TLine(10.9,2.75,10.9,8.2);
l->SetLineColor(kRed);
l->SetLineWidth(5);
l->Draw();
Move the mg->Draw("P"); to the end of your macro.