Please help me to solve this problem.
Please read tips for efficient and successful posting and posting code
ROOT Version: Not Provided
Platform: Not Provided
Compiler: Not Provided
Please help me to solve this problem.
Please read tips for efficient and successful posting and posting code
ROOT Version: Not Provided
Platform: Not Provided
Compiler: Not Provided
{
gStyle->SetFrameFillStyle(0);
TCanvas *c1 = new TCanvas("c1", "c1",900,900);
gStyle->SetOptStat(0);
TPad *h2_pad = new TPad("h2_pad", "h2_pad",0.0,0.0,1.0,1.0);
h2_pad->Draw();
proj1_pad = new TPad("proj1_pad", "proj1_pad",0.0,0.0,1.0,1.0);
proj1_pad->Draw();
proj2_pad = new TPad("proj2_pad", "proj2_pad",0.0,0.0,1.0,1.0);
proj2_pad->Draw();
TH2F *h2 = new TH2F("h2","",40,-4,4,40,-20,20);
Float_t px, py;
for (Int_t i = 0; i < 25000; i++) {
gRandom->Rannor(px,py);
h2->Fill(px,5*py);
}
TH1D * projh2X = h2->ProjectionX();
TH1D * projh2Y = h2->ProjectionY();
h2_pad->cd();
h2->Draw("COL");
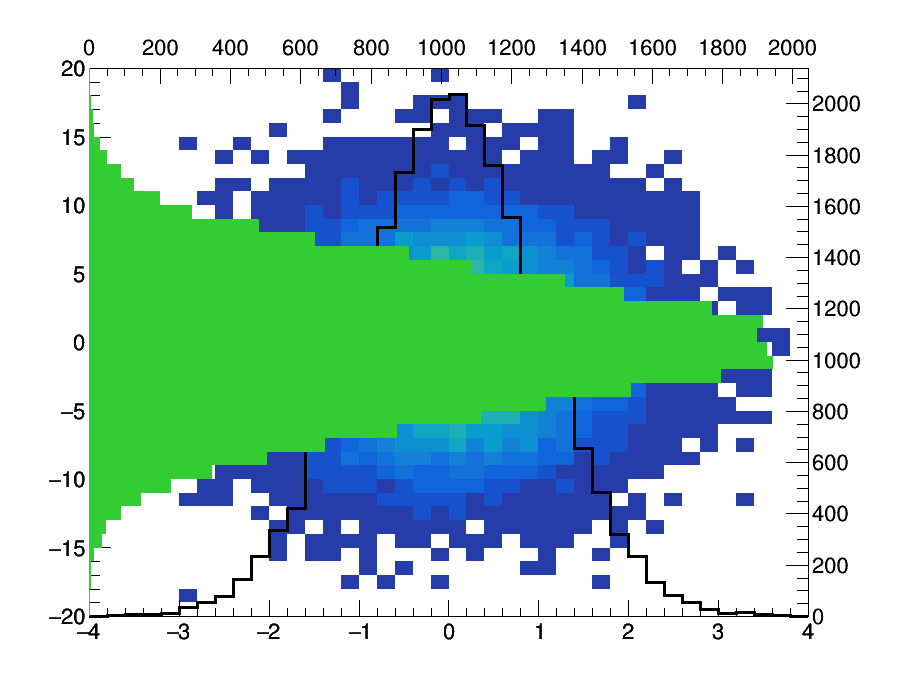
proj2_pad->cd();
proj2_pad->SetFillStyle(4000);
projh2X->SetFillColorAlpha(kRed,0.3);
projh2X->Draw("bar Y+");
proj1_pad->cd();
proj1_pad->SetFillStyle(4000);
projh2Y->SetFillColorAlpha(kGreen,0.3);
projh2Y->Draw("hbar X+");
}
{
   gStyle->SetFrameFillStyle(0);
   TCanvas *c1 = new TCanvas("c1", "c1",900,900);
   gStyle->SetOptStat(0);

   TPad *h2_pad = new TPad("h2_pad", "h2_pad",0.0,0.0,1.0,1.0);
   h2_pad->Draw();

   proj1_pad = new TPad("proj1_pad", "proj1_pad",0.0,0.0,1.0,1.0);
   proj1_pad->Draw();

   proj2_pad = new TPad("proj2_pad", "proj2_pad",0.0,0.0,1.0,1.0);
   proj2_pad->Draw();

   TH2F *h2 = new TH2F("h2","",40,-4,4,40,-20,20);
   Float_t px, py;
   for (Int_t i = 0; i < 25000; i++) {
      gRandom->Rannor(px,py);
      h2->Fill(px,5*py);
   }
   TH1D * projh2X = h2->ProjectionX();
   TH1D * projh2Y = h2->ProjectionY();

   h2_pad->cd();
   h2->Draw("COL");

   proj2_pad->cd();
   proj2_pad->SetFillStyle(4000);
   projh2X->SetLineColor(kRed);
   projh2X->SetFillStyle(0);
   projh2X->Draw("bar Y+");

   proj1_pad->cd();
   proj1_pad->SetFillStyle(4000);
   projh2Y->SetFillColorAlpha(kGreen,0.3);
   projh2Y->SetFillStyle(0);
   projh2Y->Draw("hbar X+");
}
{
gStyle->SetFrameFillStyle(0);
TCanvas *c1 = new TCanvas("c1", "c1",900,900);
gStyle->SetOptStat(0);
TPad *h2_pad = new TPad("h2_pad", "h2_pad",0.0,0.0,1.0,1.0);
h2_pad->Draw();
proj1_pad = new TPad("proj1_pad", "proj1_pad",0.0,0.0,1.0,1.0);
proj1_pad->Draw();
proj2_pad = new TPad("proj2_pad", "proj2_pad",0.0,0.0,1.0,1.0);
proj2_pad->Draw();
TH2F *h2 = new TH2F("h2","",40,-4,4,40,-20,20);
Float_t px, py;
for (Int_t i = 0; i < 25000; i++) {
gRandom->Rannor(px,py);
h2->Fill(px,5*py);
}
TH1D * projh2X = h2->ProjectionX();
TH1D * projh2Y = h2->ProjectionY();
h2_pad->cd();
h2->Draw("COL");
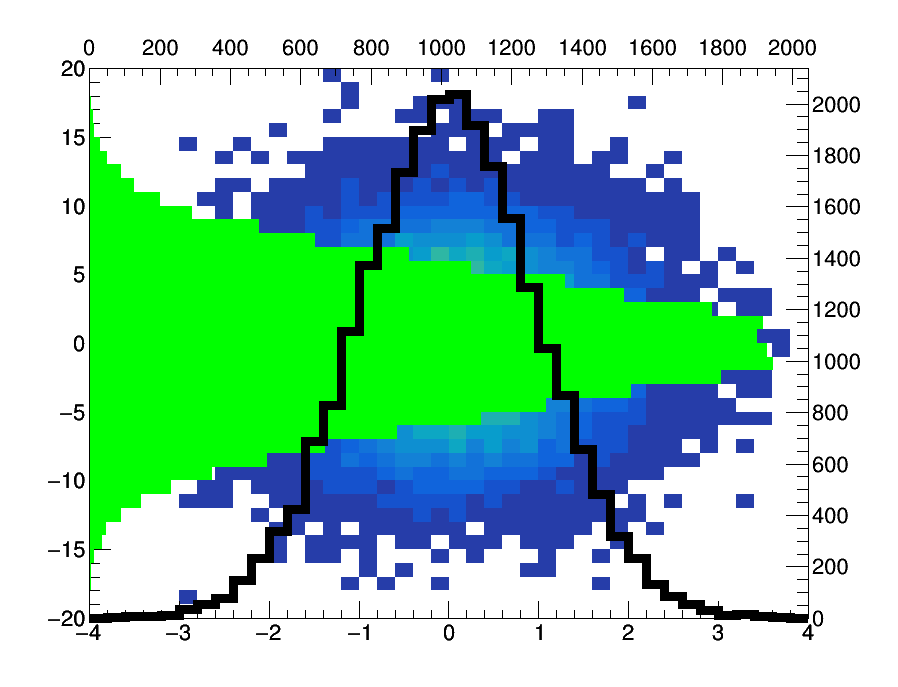
proj2_pad->cd();
proj2_pad->SetFillStyle(4000);
projh2X->SetLineColor(kRed);
projh2X->SetFillStyle(0);
projh2X->SetLineWidth(3);
projh2X->Draw("HIST Y+");
proj1_pad->cd();
proj1_pad->SetFillStyle(4000);
projh2Y->SetFillColorAlpha(kGreen,0.3);
projh2Y->SetLineWidth(0);
projh2Y->SetFillStyle(0);
auto g = new TGraph();
int n = projh2Y->GetNbinsX();
for (int i=0; i<n; i++) {
g->SetPoint(i+1, projh2Y->GetBinContent(i), projh2Y->GetBinCenter(i) );
}
projh2Y->Draw("hbar X+");
g->SetLineWidth(3);
g->Draw("L");
}
Ok this is more tricky I need time.
Thank you Sir,
"I will be waiting for your help "
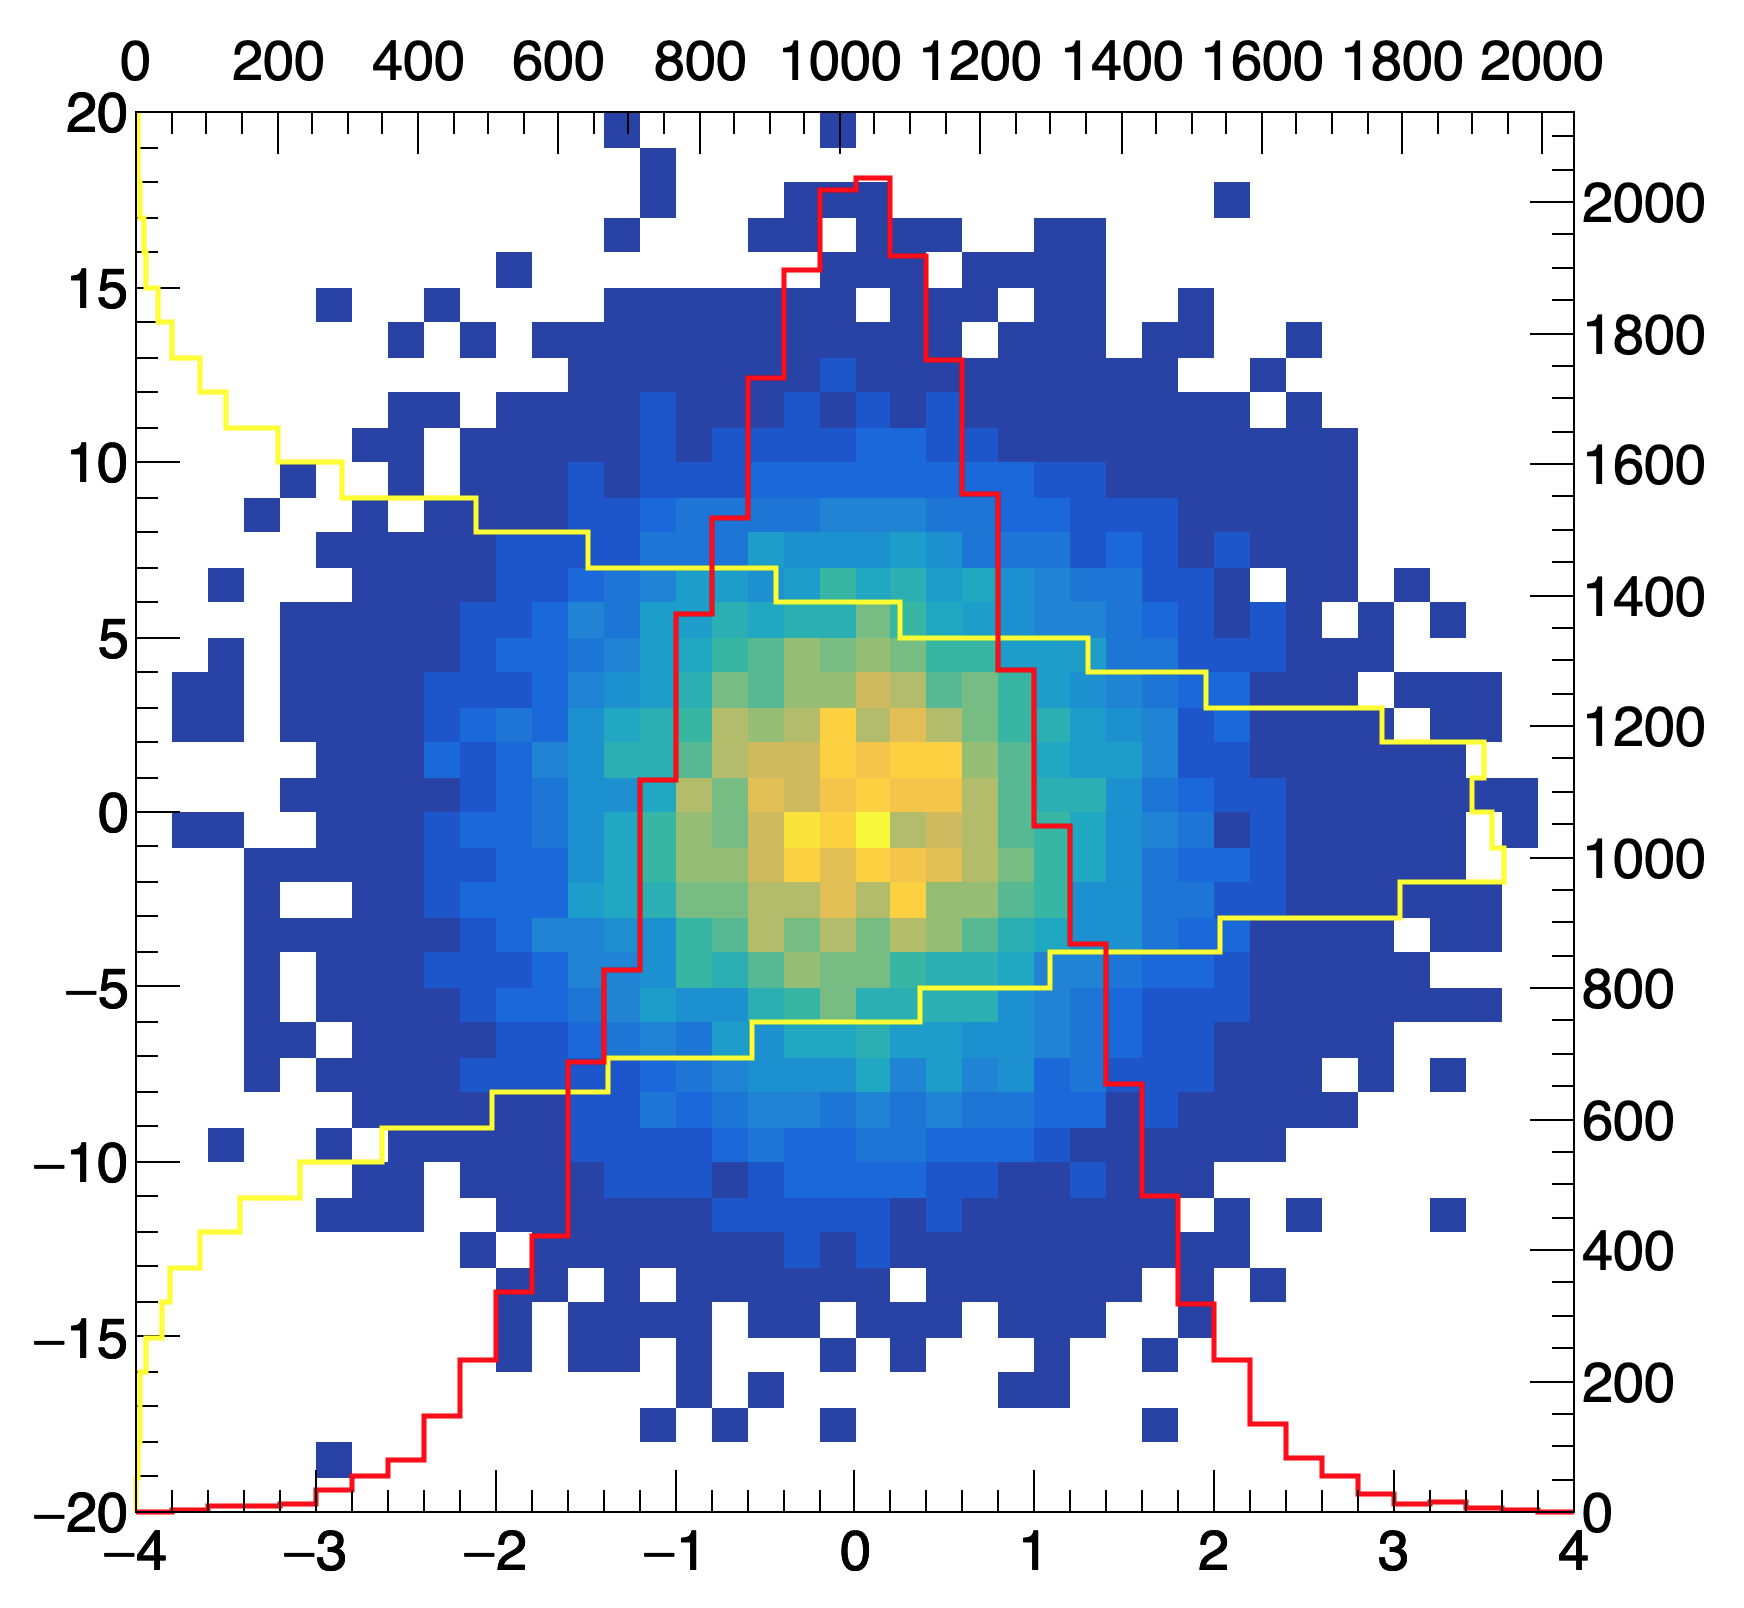
{
gStyle->SetFrameFillStyle(0);
TCanvas *c1 = new TCanvas("c1", "c1",900,900);
gStyle->SetOptStat(0);
TPad *h2_pad = new TPad("h2_pad", "h2_pad",0.0,0.0,1.0,1.0);
h2_pad->Draw();
proj1_pad = new TPad("proj1_pad", "proj1_pad",0.0,0.0,1.0,1.0);
proj1_pad->Draw();
proj2_pad = new TPad("proj2_pad", "proj2_pad",0.0,0.0,1.0,1.0);
proj2_pad->Draw();
TH2F *h2 = new TH2F("h2","",40,-4,4,40,-20,20);
Float_t px, py;
for (Int_t i = 0; i < 25000; i++) {
gRandom->Rannor(px,py);
h2->Fill(px,5*py);
}
TH1D * projh2X = h2->ProjectionX();
TH1D * projh2Y = h2->ProjectionY();
h2_pad->cd();
h2->Draw("COL");
proj2_pad->cd();
proj2_pad->SetFillStyle(4000);
projh2X->SetLineColor(kRed);
projh2X->SetFillStyle(0);
projh2X->SetLineWidth(5);
projh2X->Draw("HIST Y+");
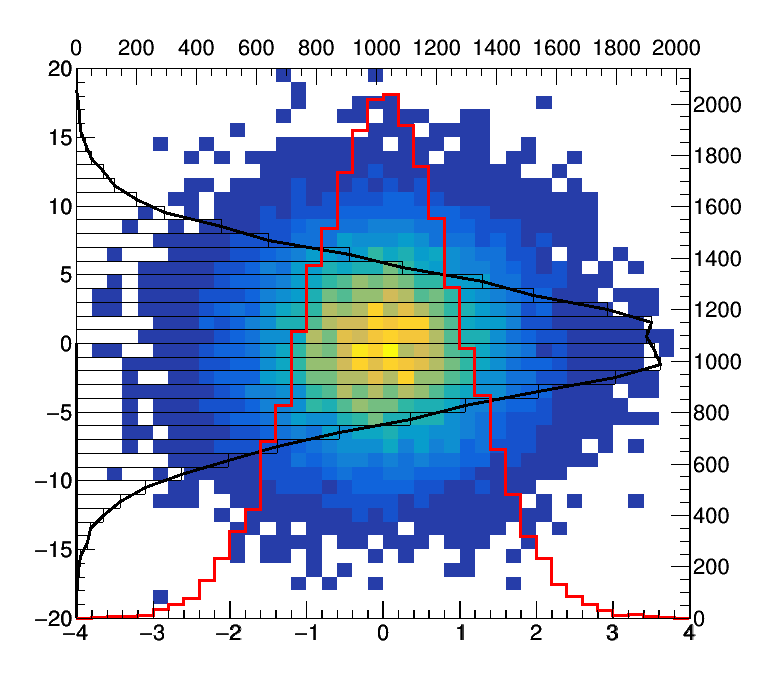
proj1_pad->cd();
proj1_pad->SetFillStyle(4000);
projh2Y->SetLineWidth(0);
projh2Y->SetFillStyle(0);
auto g = new TGraph();
int n = projh2Y->GetNbinsX();
double x, y;
double bw = projh2Y->GetBinWidth(1);
int i = 0;
y = projh2Y->GetBinLowEdge(1);
g->SetPoint(i, 0, y);
for (int b=1; b<=n; b++) {
x = projh2Y->GetBinContent(b);
y = projh2Y->GetBinLowEdge(b);
g->SetPoint(i, x, y); i++;
g->SetPoint(i, x, y+bw); i++;
}
projh2Y->Draw("hbar X+");
g->SetLineColor(kYellow);
g->SetLineWidth(5);
g->Draw("L");
}
Can you use a more recent version of ROOT ? the macro I sent you relies on the fact a line width of 0 allow to not draw the line.
Thank you for your reply… ok I am checking it.
Hi couet,
I am a PhD student in experimental high energy physics in ALICE. I also need this plot . I am also not getting this plot by running the code given here.
As suggested, I also tried with a latest version of ROOT in Aliroot framework (lxplus) vAN-20200308_ROOT6-1 and also the same version in root 5, but it did not work. I am still getting the horizontal lines.
Thanks,
Sanchari
I checked the aliroot version. It was written ROOT 6-2 in that aliroot version.
I am getting the horizontal lines in the y-projection histogram by usjing ROOT 6.12.04. Can you please tell me what version root is used to get the actual histogram.
According to git history it was implemented in 2015 in ROOT 6.04
For me it does not work with 6.16/00 nor with 6.14/06. First 6.18/04, 6.19/02 and 6.20/00 work fine.
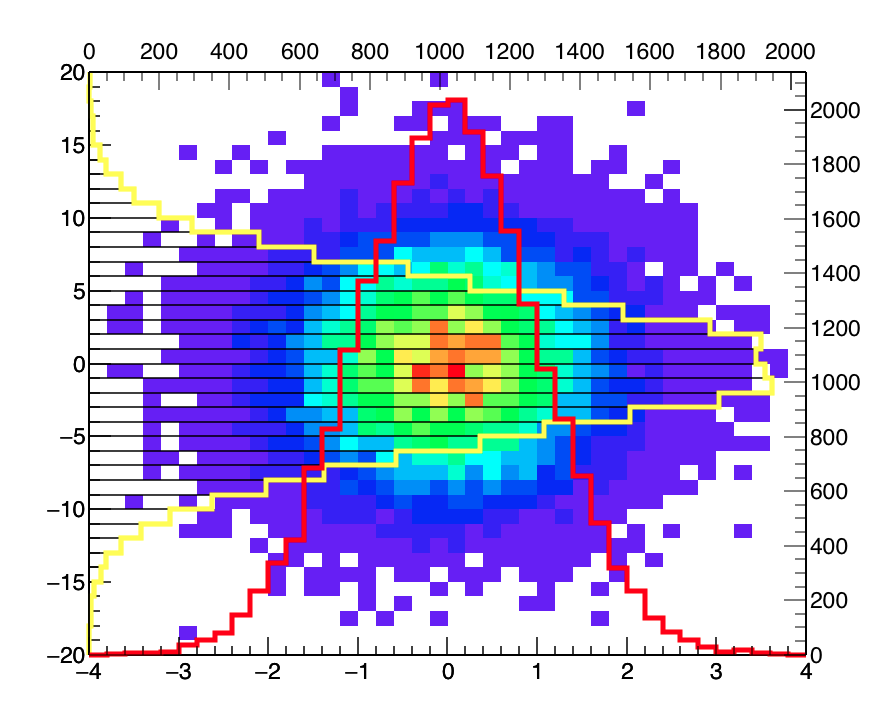
Ok, instead of discussing which ROOT version has it or not, I made a new version of the macro which does not depend on the line width = 0:
{
	gStyle->SetFrameFillStyle(0);
	TCanvas *c1 = new TCanvas("c1", "c1",900,900);
	gStyle->SetOptStat(0);

	TPad *h2_pad = new TPad("h2_pad", "h2_pad",0.0,0.0,1.0,1.0);
	h2_pad->Draw();

	proj1_pad = new TPad("proj1_pad", "proj1_pad",0.0,0.0,1.0,1.0);
	proj1_pad->Draw();

	proj2_pad = new TPad("proj2_pad", "proj2_pad",0.0,0.0,1.0,1.0);
	proj2_pad->Draw();

	TH2F *h2 = new TH2F("h2","",40,-4,4,40,-20,20);
	Float_t px, py;
	for (Int_t i = 0; i < 25000; i++) {
		gRandom->Rannor(px,py);
		h2->Fill(px,5*py);
	}
	TH1D * projh2X = h2->ProjectionX();
	TH1D * projh2Y = h2->ProjectionY();

	h2_pad->cd();
	h2->Draw("COL");

	proj2_pad->cd();
	proj2_pad->SetFillStyle(4000);
	projh2X->SetLineColor(kRed);
	projh2X->SetFillStyle(0);
	projh2X->SetLineWidth(5);
	projh2X->Draw("HIST Y+");

	proj1_pad->cd();
   TH1D *f = new TH1D("f","f",100,projh2Y->GetXaxis()->GetXmin()
		                           ,projh2Y->GetXaxis()->GetXmax());
	f->SetMaximum(projh2Y->GetMaximum());
	f->SetMinimum(projh2Y->GetMinimum());
	proj1_pad->SetFillStyle(4000);

	projh2Y->SetFillStyle(0);
	auto g = new TGraph();
	int n = projh2Y->GetNbinsX();
	double x, y;
	double bw = projh2Y->GetBinWidth(1);
	int i = 0;
	y = projh2Y->GetBinLowEdge(1);
	g->SetPoint(i, 0, y);
	for (int b=1; b<=n; b++) {
        x = projh2Y->GetBinContent(b);
		y = projh2Y->GetBinLowEdge(b);
		g->SetPoint(i, x, y); i++;
		g->SetPoint(i, x, y+bw); i++;
	}
	f->Draw("hbar X+");
	g->SetLineColor(kYellow);
	g->SetLineWidth(5);
	g->Draw("L");
}
Dear Couet,
Thank you very much. Your code is working. I got the appropriate plot.