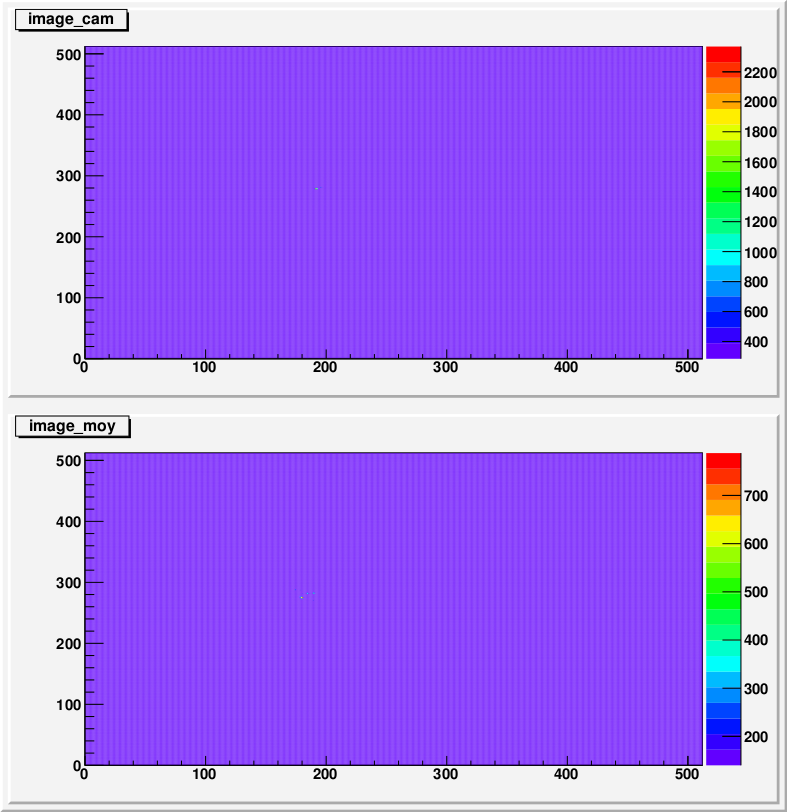
I would like to ask if it is possible to define a histogram graphics window so that the histogram axes have identical size and the histogram window is a square. The histogram is drawn with a color palette.
I attach the example with the histograms which we want to draw in this way.
The problem here is that we don’ t know the graphical size of the palette on the right and also the axis labels etc. So even if we define the pad size to be square, the histogram graphics window will not be square. That’s why I posted a question in the forum.
The palette is drawn in the margin, so it does not affect the pad ratio.
With or without palette the size and ratio of the histogram drawing area is the same.
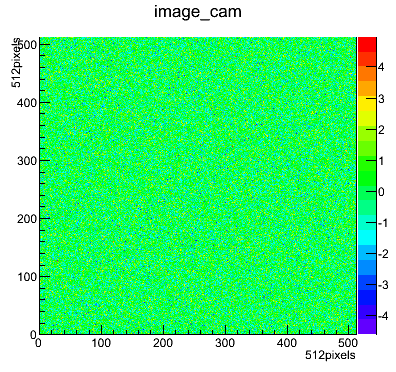
I attach an example, where the canvas size is defined as a square and the resulting picture. On my screen the window with histogram has its width a bit bigger than its height. Please, have a look.