Hi everybody,
I currently have a question regarding the integral of a model component pdf that I posted here (https://root-forum.cern.ch/t/roofit-integral-error-and-manual-question/45864), where I am receiving great help from @jonas. I also have another issue regarding the same model but thought it would make sense to open a separate topic. However it concerns the same simple model that I posted in the original question and also my question is very general I think. My questions is about the “goodness of fit” measure after fitting the model (in the previous topic). Explicitly, how to extract it. I’ve found a couple of ways, but not all of them give me the same result or a reasonable result at all. Maybe someone can clarify this for me?  Probably I am doing something stupid…
I will try to first provide the context of my problem and then the methods I tried and the results I have so far. So, what I am doing is fitting the model to a histogram as
RooFitResult *fit_result_data = model.fitTo(hdata, Range("fullRange"), Save(), PrintLevel(-1));
I can also plot it without trouble:
RooPlot *xframe04 = x.frame(Title("RooFit fit"));
hdata.plotOn(xframe04, Name("Data"));
model.plotOn(xframe04, Name("Model with errors"), VisualizeError(*fit_result_data));
and so on… Now, I would like to extract a measure for the goodness of fit. Preferably the chi², ndf, chi²/ndf and the corresponding p-value to test the hypothesis of the histogram following the distribution/pdf-model. In general I understand that the ndf should be “50 - 2 - m”, as I have 50 bins, 2 fitting parameters (A_sig and A_bkg, see model of previous topic) and some number “m” of bins with 0 entries (I have two unweighted histograms).
I would like to illustrate to cases; one very good fit (case 1) and one “ok”-fit (case 2).
Case 1:
m = 5, so 5 bins with 0 entries. Very good fit, basically fitting the model to the data I extracted it from. So, I know that the chi² should be very small and the ndf should be 50 - 2 - 5 = 43.
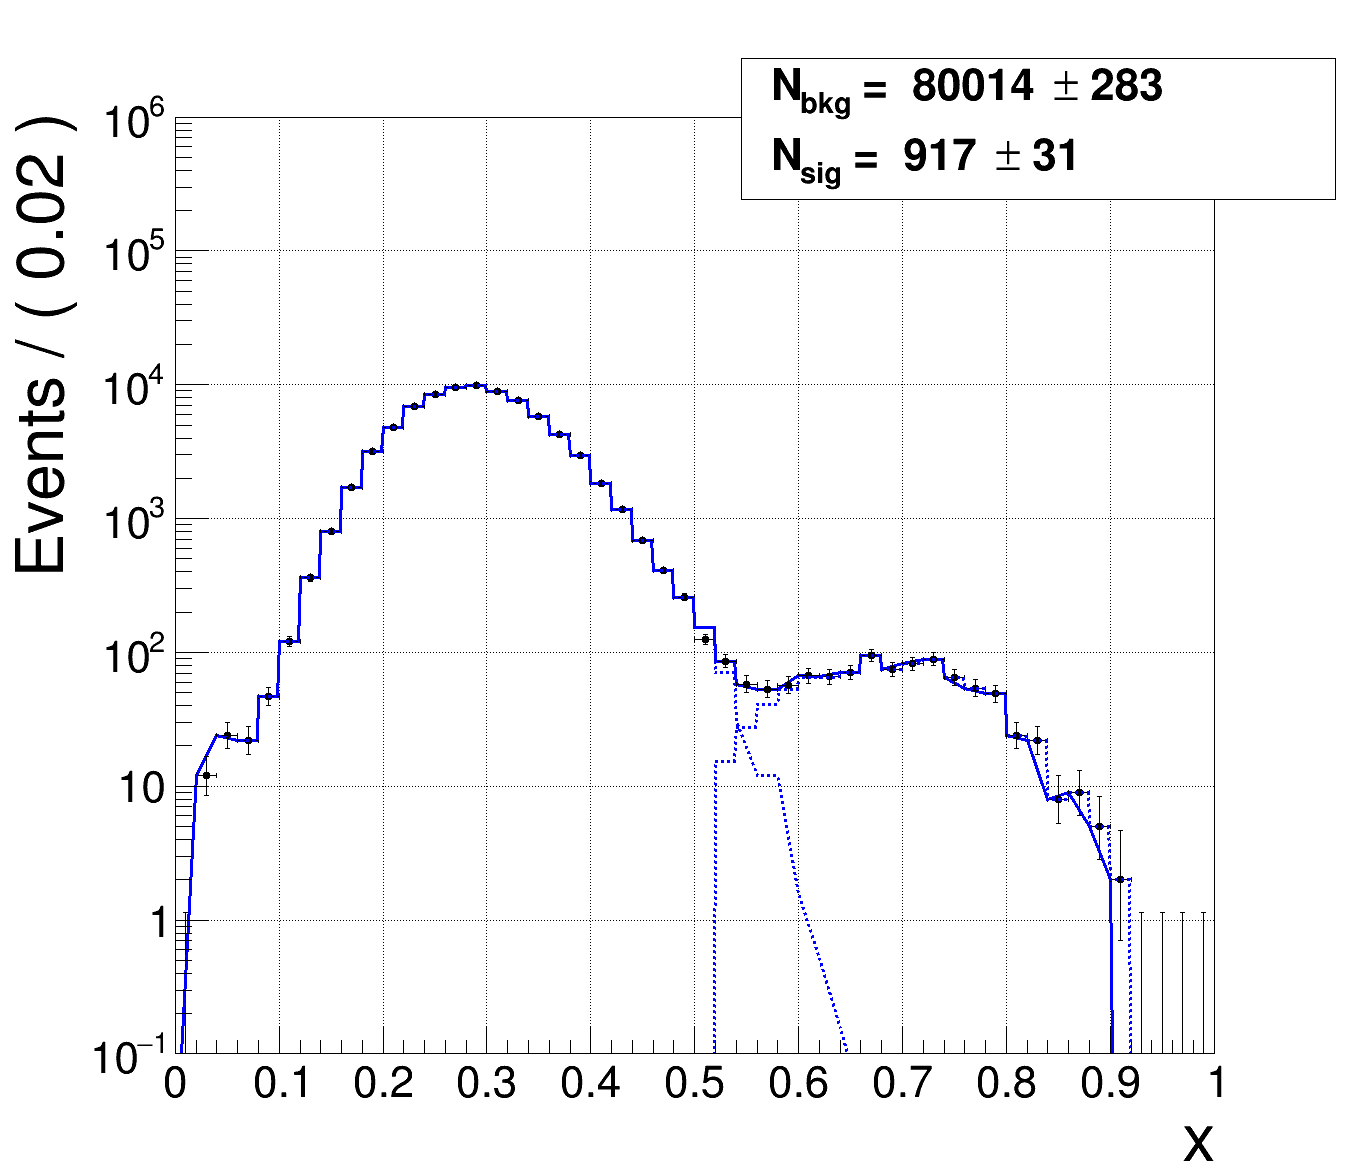
(blue is the whole model and the dashed lines are the two components, black is the data)
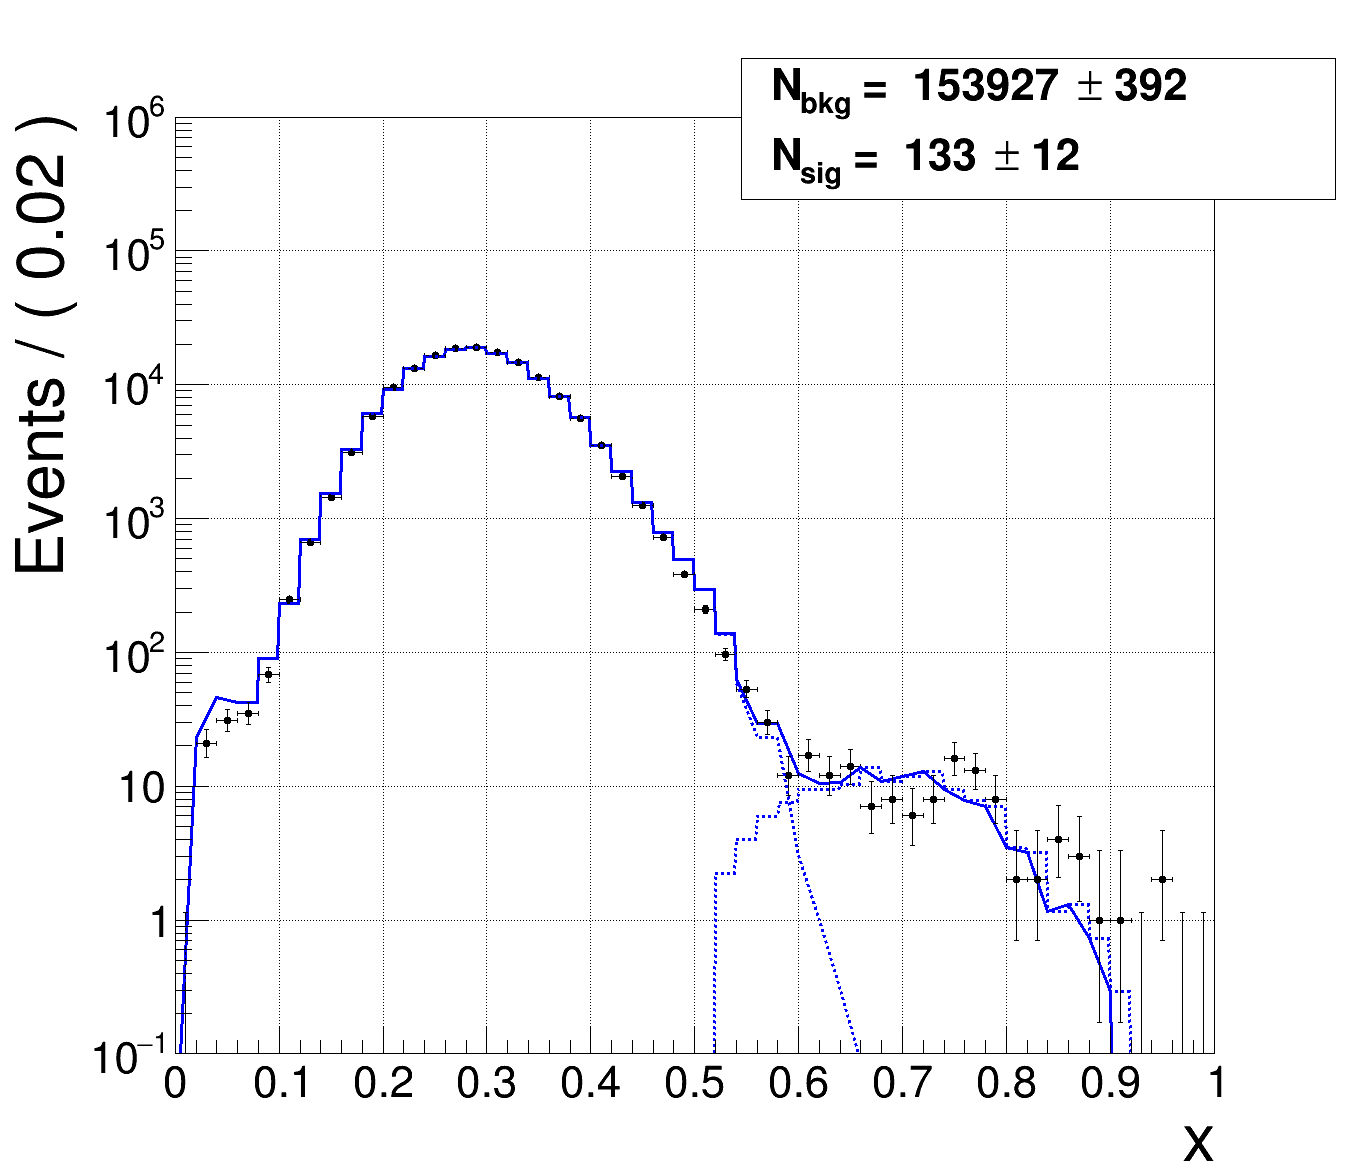
Case 2:
m = 4, so 4 bins with 0 entries. Ok fit, basically fitting the model to independent data and testing whether the data agrees with the model. I only know that the ndf should be 50 - 2 - 4 = 44 and the chi² could be anything.
Now I will just summarize my attempts to extract the chi2, ndf and p-value so far and the results/issues I have.
Method 1 - RooPlot::chiSquare():
My first idea was to apply this method right after plotting as
cout << "chi^2/ndf = " << xframe04->chiSquare(2) << endl;
where 2 indicates the nr. of fitting parameters… this returns me:
case 1: chi^2/ndf = 0.465877
case 2: chi^2/ndf = 4.91932
This alone would be believable. I think there is no similar method to also directly evaluate the chi² or the p value? However, since I know the ndf for each case, I can calculate the chi² by hand and with ROOT::Math::chisquared_cdf_c(chi², ndf) am able to get the p value directly. Then, I end up with
case 1: chi^2/ndf = 0.465877, chi^2 = 20.0327, ndf = 43, p-value = 0.998919 (amazing as expected)
case 2: chi^2/ndf = 4.91932, chi^2 = 226.289, ndf = 44, p-value = 2.33382e-26 (ok very bad…)
It is unclear to me however, how one could supply a range here?
Method 2:
Another possibility seems to be to use “createChi2” directly on the model as:
RooAbsReal * chi2_o_ndf = model.createChi2(hdata, Range("fullRange"));
cout << "chi2_o_ndf: " << chi2_o_ndf->getVal() << endl;
It seems to me, that the advantage here is that one can supply a range very easily. The number of parameters can not be supplied I think, but they are probably taken from the model directly. This results in:
case 1: chi^2/ndf = 5.45976, p-value = 3.05669e-28
case 2: chi^2/ndf = 3.10989e+12, p-value = 0
where I used again the same steps as in method 1 to get to the p-value. These values are completely different…
Method 3:
Another idea was to turn the model into a histogram (either via “createHistogram” or via “asTF” and then “GetHistogram”) and then calculate the chi² via TH1::Chi2Test" as:
TH1 * th_model = model.createHistogram("chi_histo", x, IntrinsicBinning(), Extended(kTRUE));
// or similar, and then:
th_model->Chi2Test(hdata, "UU P");
this prints the directly the whole result of a chi2 test of two unweighted histograms. Here it is unclear to me, how one could set the number of parameters though (or a range). The results are:
case 1: Chi2 = 5.372482, Prob = 1, NDF = 44, igood = 0
case 2: Chi2 = 292.846044, Prob = 4.58335e-38, NDF = 45, igood = 1
which, in my opinion, is problematic in many ways. In case 1, the chi2 is similar to method 2 but not equal. The ndf is 44 instead of 43 (I guess it just assumes that the number of parameters is 1 and ignores all bins with 0 entries automatically). And then igood = 0 should suggest that both histograms have no bins with 0 entries, but the ndf suggests otherwise (and I know, that it is otherwise). In case 2 the chi2 is neither similar to method 1 nor to method 2…
Method 4:
Intuitively, my first idea was that one should be able to somehow extract the chi2, ndf, pvalue from the initial RooFitResult. But this does not seem to be possible as far as I learned.
Or I thought maybe one can transform it into a traditional TFitResult and then use “->Ndf()”, “->Chi2” and “->Prob()”. But I think this is also not possible. So, method 4 has no results.
Sorry for this super long question, but at this point I am really confused as to which method I should use and why they don’t coincide. What am I doing wrong? Please help me
Best,
Alex
 I was just overall very confused which method to use as there are so many (I also found the “RooChi2Var” now for example). Your comment, that in case 2 some of the very high x values would blow up the chi² was certainly also justified. However, my confusion came more from the fact that the several methods should still lead to the same result, no matter how big the chi².
 Then, to my understanding, the model it self could not have messed up the chi² depending on the method used.