ROOT Version: 6.36.02
Platform: WSL2 (unbuntu 22.04)
Python Version: 3.10.12
I’m using Jupyter Notebook to draw and adjust figures. But I find there is some problem to display TCanvas in the output region under input cell.
I create a global TCanvas,
c1=ROOT.TCanvas("c1","c1",800,600)
and draw objects on this canvas to get my figures.
I also define some functions to control the draw options
import ROOT
import math
from ctypes import c_double
import numpy as np
import pandas as pd
from IPython.display import clear_output

from ipytools import *

def draw_phaseshift(timedata, xtit="E_{c.m.} (MeV)", ytit="#delta_{0} (degree)", yrange=[],xrange=[],legshow=True,grid=True,ticks=True):
 c1.cd()
 if grid:
  ROOT.gPad.SetGrid()
 if ticks:
  ROOT.gPad.SetTicks()

 setcolors(timedata.mg,color,Alpha=timedata.Alpha)
 timedata.resetLeg()

 mg=timedata.mg.Clone()
 #mg=timedata.getiGraph(5)
 leg=timedata.leg.Clone()
 mg.GetYaxis().SetTitle(ytit)
 mg.GetYaxis().SetTitleOffset(1.)
 mg.GetYaxis().SetTitleSize(0.06)
 mg.GetYaxis().SetLabelSize(0.06)
 mg.GetYaxis().SetNdivisions(505)
 if len(yrange) == 2:
  mg.GetYaxis().SetRangeUser(yrange[0],yrange[1])
 mg.GetXaxis().SetTitle(xtit)
 mg.GetXaxis().SetTitleSize(0.06)
 mg.GetXaxis().SetLabelSize(0.06)
 mg.GetXaxis().SetTitleOffset(1.)
 if len(xrange) == 2:
  mg.GetXaxis().SetRangeUser(xrange[0],xrange[1])
 else:
  mg.GetXaxis().SetRangeUser(0,50)
 if (timedata.drawoption=="AC3"):
  mg.Draw("ACX")
  mg.Draw("3")
 else:
  mg.Draw(str(timedata.drawoption))
 if legshow:
  leg.Draw("same")
 c1.Draw()
Where timedata is a C++ class, used for store my data
when I run the following cell
%jsroot on
tstart=16
tend=18
t_list=[18,16,17]
ifmisnered=1
spin=2
if (ifmisnered==1):
sub="_misnered"
else:
sub=""
labels=["a", "b"]
timedata=ROOT.timedata(f"output/aveset/pot_{spin*2+1}s{spin}_cen_FconfNOmgccc_t%03d_B01_1600conf_080bin{sub}_observables.root",t_list,"phase_shift_nocoul",1/math.sqrt(2*m_red),180/3.1415926535897, "AC3")
#timedata=ROOT.timedata("output/set1/pot_3s1_cen_FconfNOmgccc_t%03d_1600conf_080bin_observables.root",16,18,"phase_shift_nocoul",1/math.sqrt(2*m_red),180/3.1415926535897, "AC4")
timedata.setFormula("x*x")
#timedata.leg.SetX1(0.63)
timedata.leg.SetY1(0.2)
#timedata.leg.SetX2(0.93)
timedata.leg.SetY2(0.5)
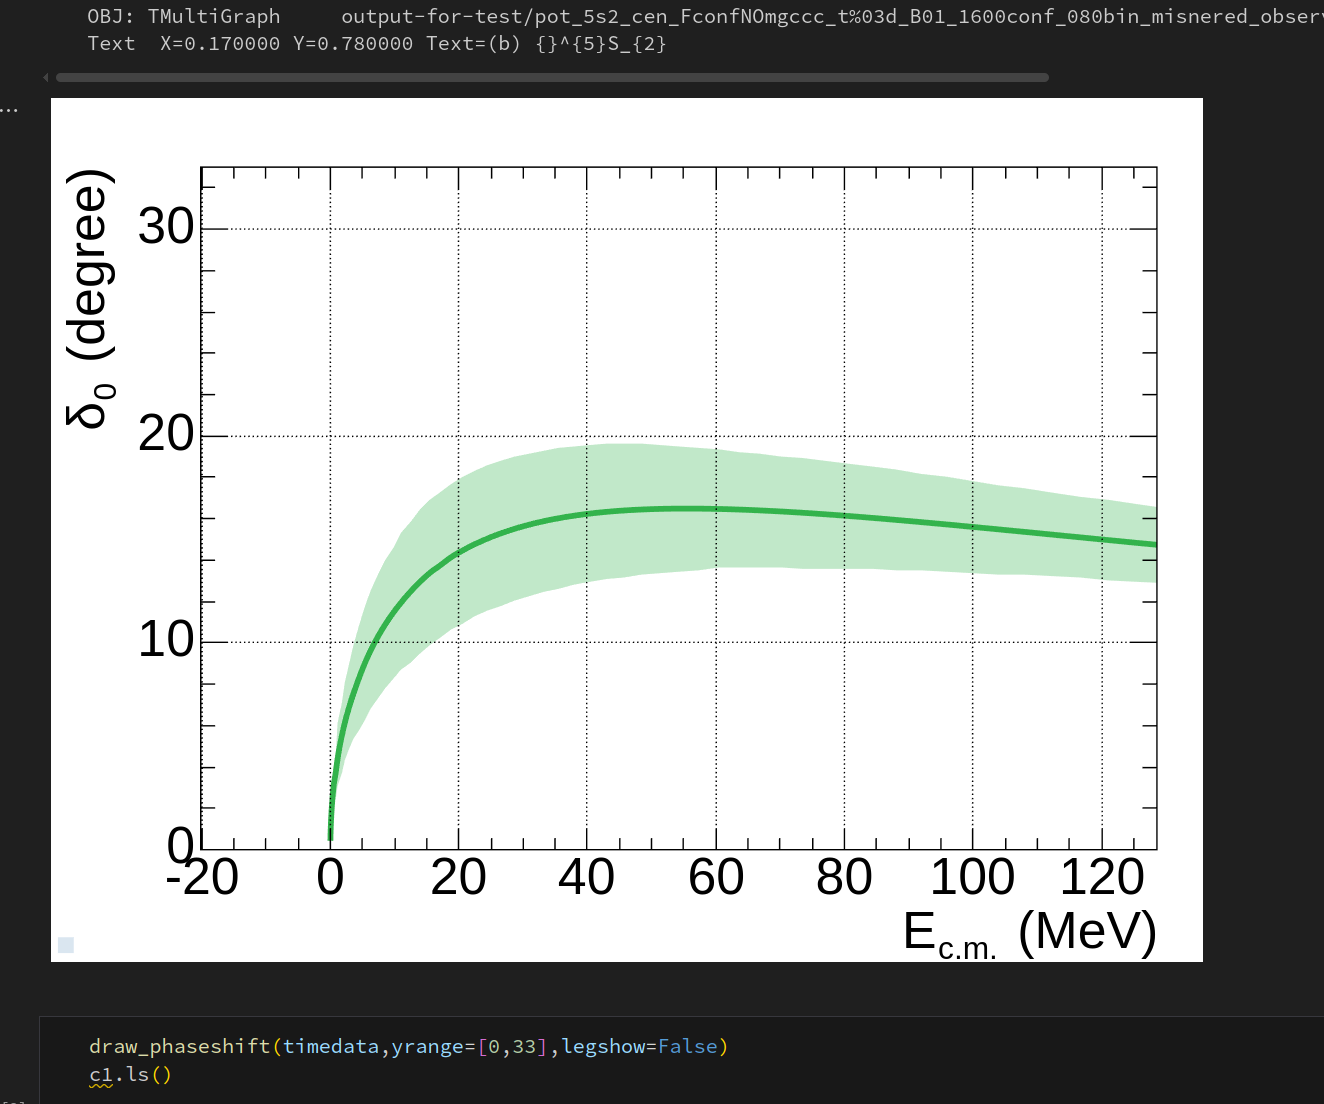
draw_phaseshift(timedata,yrange=[0,33],legshow=False)
leg2 = ROOT.TLegend(timedata.leg.GetX1(), timedata.leg.GetY1(), timedata.leg.GetX2(), timedata.leg.GetY2())
t_list_index=[[i,t_list[i]] for i,t in enumerate(t_list)]
for i,t in sorted(t_list_index, key=lambda x: x[1], reverse=True):
leg2.AddEntry(timedata.mg.GetListOfGraphs().At(i), f"t/a = {t}", "fl")
if spin==1:
leg2.Draw("same")
#timedata.mg.Draw("p same")
#add a label
Label=ROOT.TLatex(0.17,0.78, f"({labels[spin-1]}) {{}}^{{{2*spin+1}}}S_{{{spin}}}")
Label.SetTextSize(0.06)
Label.SetNDC()
Label.Draw()
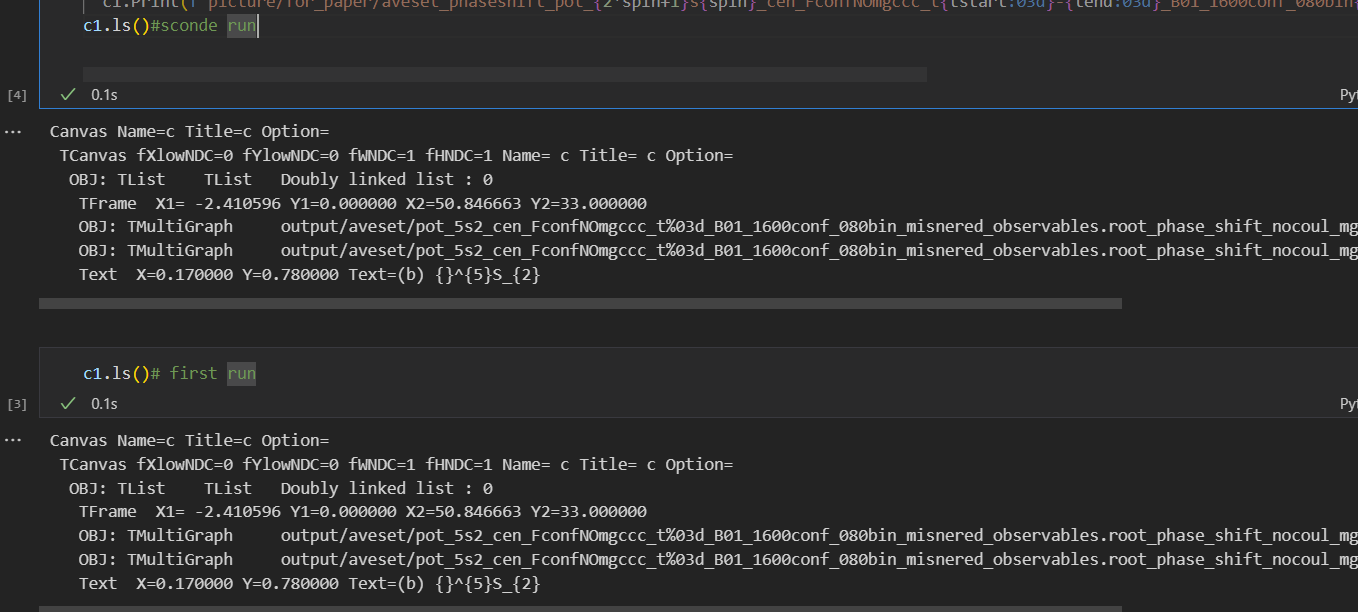
the canvas can display normally under the input cell
But when I run this cell for second time, the canvas disappared.
What should I do to correctly display canvas? Is my data too large?
Following are some defination of the class
class graphdata
{
public:
  TMultiGraph *mg = nullptr;
  int ngraphs = 0;
  TGraphErrors *aveGraph = nullptr;
  TLegend *leg = new TLegend(0.6, 0.4, 0.85, 0.65);

  double a_x = 1;
  double a_y = 1;
  TF1 *f_x = new TF1("f_x", "x", 0, 100);

  int Color = kAzure;
  int Pallete = EColorPalette::kLightTemperature;
  double Alpha = 0.3;
  int MarkerStyle = 20;
  double MarkerSize = 0.5;
  string drawoption = "AP";

  graphdata();
  graphdata(double a_x, double a_y);
  graphdata(double a_x, double a_y, string drawoption);
  graphdata(const graphdata &other);
  ~graphdata();

  TLegend *resetLeg(vector<double> Locate={0.6, 0.4, 0.85, 0.65}, double TextSize = 0.05, int TextFont = 42, string suffix = "");
...
}
class timedata : public graphdata
{
public:
  timedata(string filename_model, int time_start, int time_end, string plotname, string drawopt = "AP");
  timedata(string filename_model, int time_start, int time_end, string plotname, double a_x, double a_y, string drawopt = "AP");
  timedata(string filename_model, vector<int> t_list, string plotname, string drawopt = "AP");
  timedata(string filename_model, vector<int> t_list, string plotname, double a_x, double a_y, string drawopt = "AP");
  timedata(vector<jkdata> &datalist, vector<int> t_list, string plotname, string drawopt = "AP");
  timedata(vector<jkdata> &datalist, vector<int> t_list, string plotname, double a_x, double a_y, string drawopt = "AP");
  ~timedata();
....
}