This that I do not understand.
Can you try the same with %jsroot off?
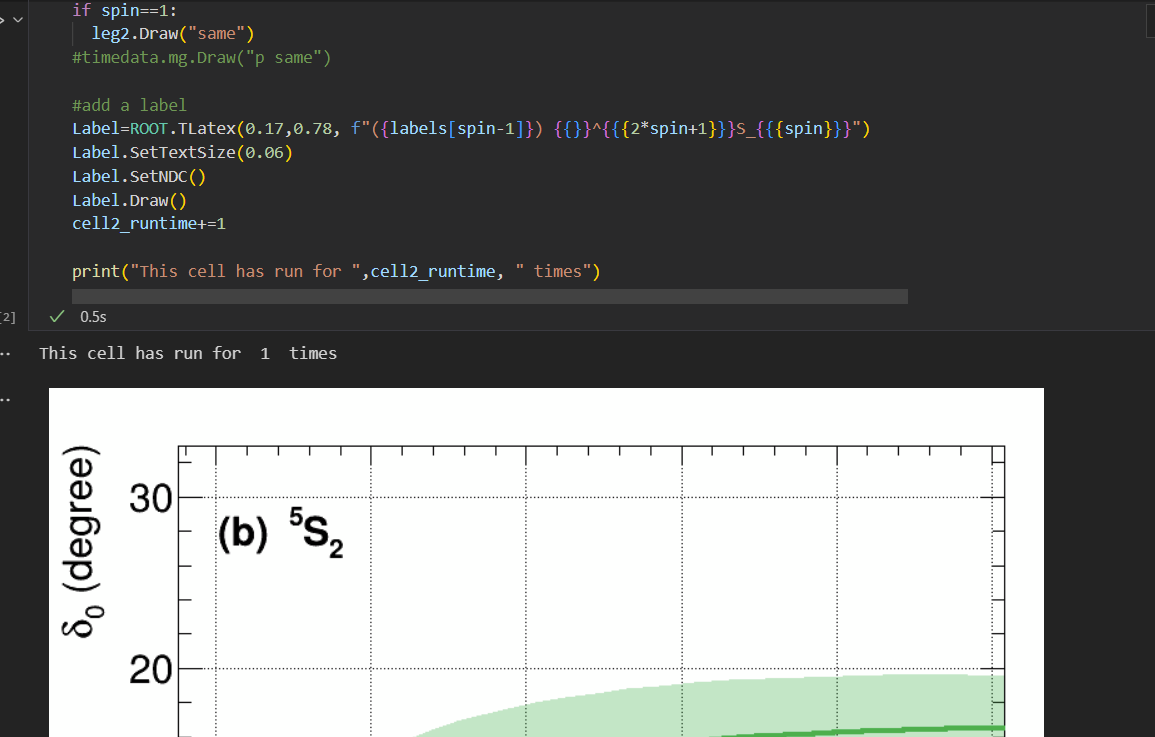
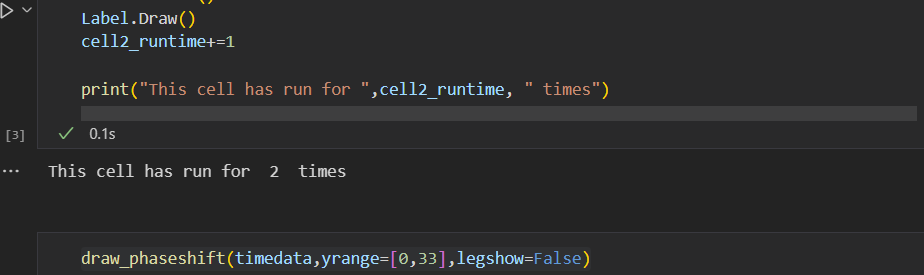
I upload modified Canvas.ipynb - it really missing second plot. Also when checking in file sources.
I suspect here some python ownership problems that histogram or canvas deleted in-between and this not correctly recognized by pyroot.
To overcome such problem - try create new canvas with different name before start drawing.
I see, so it’s better to recreate a new canvas when I want to draw a new figure.
But when I open a new cell and run c1.Draw() without tuning axis ranges, the canvas will appear again in the new cell’s output as I upload Canvas.ipynb shows.