I want to plot RooDataSet outside a blinded region, [120000, 280000]. Therefore I tried using Range and CutRange. However, ROOT only makes the bins inside the blinded region to be zero. Could you teach me the proper way to completely “blank” the blinded region without plotting any data points?
In this case you need to use the Binning command argument. The CutRange is used to select the entries from the dataset you are filling into the histogram, but then you get indeed bins with zero counts. You need to control the limits of the plotted histograms instead.
However, you can’t pass two binnings comma-separated in a single call to plotOn(). You have two plot two histograms like this:
import ROOT
ROOT.gROOT.SetBatch(True)
ws = ROOT.RooWorkspace("ws")
ws.factory("fitvar[100000,300000]")
x = ws.var("fitvar")
x.setRange("signal_region", 120000, 280000)
x.setRange("lower_sideband", 100000, 120000)
x.setRange("upper_sideband", 280000, 300000)
x.setRange("full_range", 100000, 300000)
# Set the number of bins in the sidebands such that the bin boundaries
# are compatible with the binning for the full range:
x.setBins(10, "lower_sideband")
x.setBins(10, "upper_sideband")
# If you want to cross-check the binning, comment this out:
# x.getBinning().Print()
# x.getBinning("lower_sideband").Print()
# x.getBinning("upper_sideband").Print()
df = ROOT.RDataFrame("DecayTree", "demo.root")
data = df.Book(
ROOT.std.move(
ROOT.RooDataSetHelper(
"data",
"data",
ROOT.RooArgSet(x),
)
),
["fitvar"],
).GetValue()
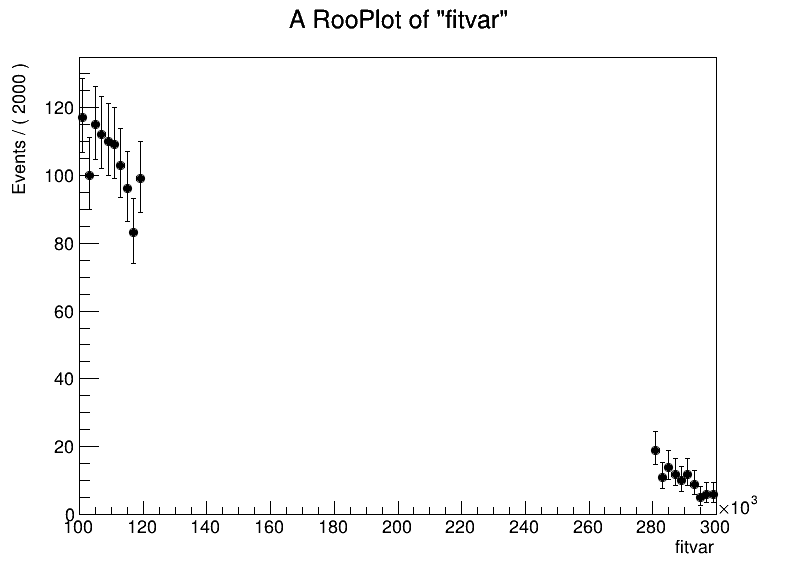
frame = x.frame()
data.plotOn(frame, Name="data_lower_sideband", Binning="lower_sideband")
data.plotOn(frame, Name="data_lower_sideband", Binning="upper_sideband")
c = ROOT.TCanvas("c", "c", 800, 600)
frame.Draw()
c.SaveAs("demo.pdf")
Just make sure that the binnings in your sidebands are compatible with the binning over the full range, as I explain in the code.