Hello,
This is the function that i use to write the overlayed histograms.
def overplot(h1,h2,spec1,spec2,opath,n):
c1 = R.TCanvas()
c1.SetTickx()
c1.SetTicky()
c1.SetLeftMargin(0.1)
c1.SetRightMargin(0.18)
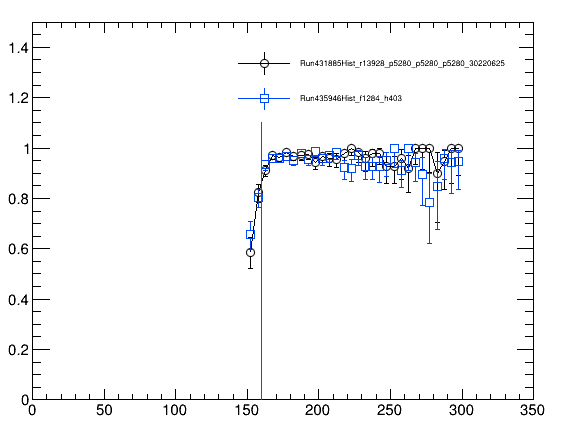
if h1.IsA().InheritsFrom("TEfficiency") == True and h2.IsA().InheritsFrom("TEfficiency") == True:
# h1.SetMarkerStyle(24)
h2.SetMarkerStyle(25)
# h1.SetMarkerColorAlpha(R.kBlack,0.99)
h2.SetMarkerColorAlpha(R.kBlue,0.8)
# h1.SetLineColor(R.kBlack)
h2.SetLineColor(R.kBlue)
h11=h1.GetPassedHistogram()
h22=h2.GetPassedHistogram()
chi2=h11.Chi2Test(h22,"UU")
# h1.GetListOfFunctions().AddFirst(hh1)
latex=R.TLatex()
latex.SetTextSize(0.05)
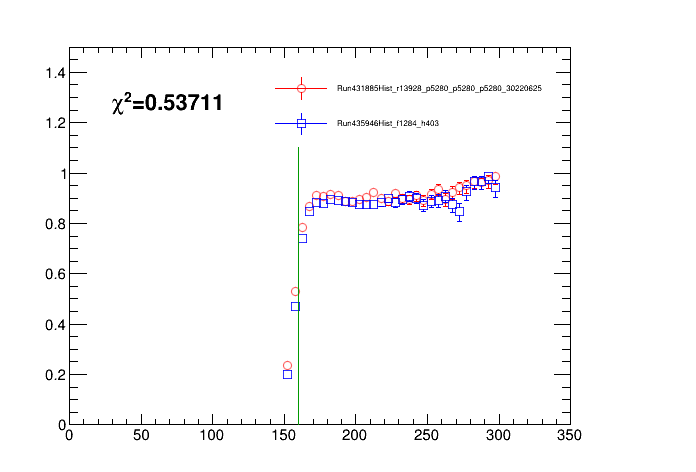
if h1.GetName()=="EffHLT_tauPt_wrt_Offline":
c1.DrawFrame(0,0,350,1.5)
latex.DrawLatex(30,1.25,"#chi^{2}="+str(chi2)[0:7])
elif h1.GetName()=="EffHLT_averageMu_wrt_Offline":
c1.DrawFrame(0,0.2,65,1.4)
elif h1.GetName()=="EffHLT_tauEta_wrt_Offline":
c1.DrawFrame(-3.5,0.65,3.5,1.25)
elif h1.GetName()=="EffHLT_tauPhi_wrt_Offline":
c1.DrawFrame(-3.5,0.72,3.5,1.25)
elif h1.GetName()=="EffHLT_tauPt_coarse_wrt_Offline":
c1.DrawFrame(0,0.65,550,1.4)
h1.Draw("HIST")
h2.Draw("SAME1")
if h1.GetName()=="EffHLT_tauPt_wrt_Offline":
h3=R.TLine(n,0,n,1.1)
h3.SetLineColor(R.kRed)
h3.Draw("SAME1")
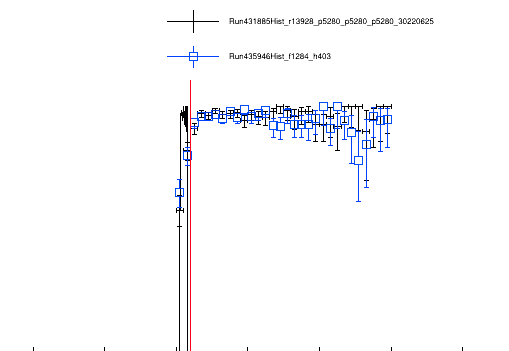
legend=R.TLegend(0.38,0.7,0.8,0.85)
legend.AddEntry(h1,spec1,"LEP")
legend.AddEntry(h2,spec2,"LEP")
legend.SetBorderSize(0)
legend.Draw()
c1.Print(opath+"/"+h1.GetName()+".png")
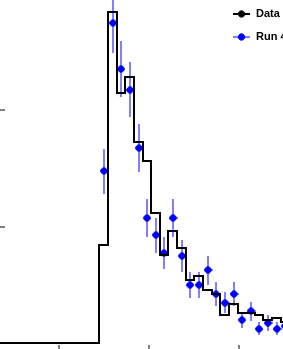
elif h1.InheritsFrom("TTree")==False and h2.InheritsFrom("TTree")==False:
h1.SetFillColor(R.kRed)
h2.SetFillColor(R.kBlue)
if h1.GetMaximumBin()>h2.GetMaximumBin():
h1.Draw("SAME4")
h2.Draw("SAME4")
else:
h2.Draw("SAME4")
h1.Draw("SAME4")
legend=R.TLegend(0.6,0.9,1,1)
legend.AddEntry(h1,spec1,"L")
legend.AddEntry(h2,spec2,"L")
legend.Draw()
hist_name = opath+h1.GetName()+".png"
c1.Print(opath+"/"+h1.GetName()+".png")
c1.Update()
c1.Clear()
return
it’ would be great to get the curve like in the previous comment.