I am creating a 2D color plot with the following code:
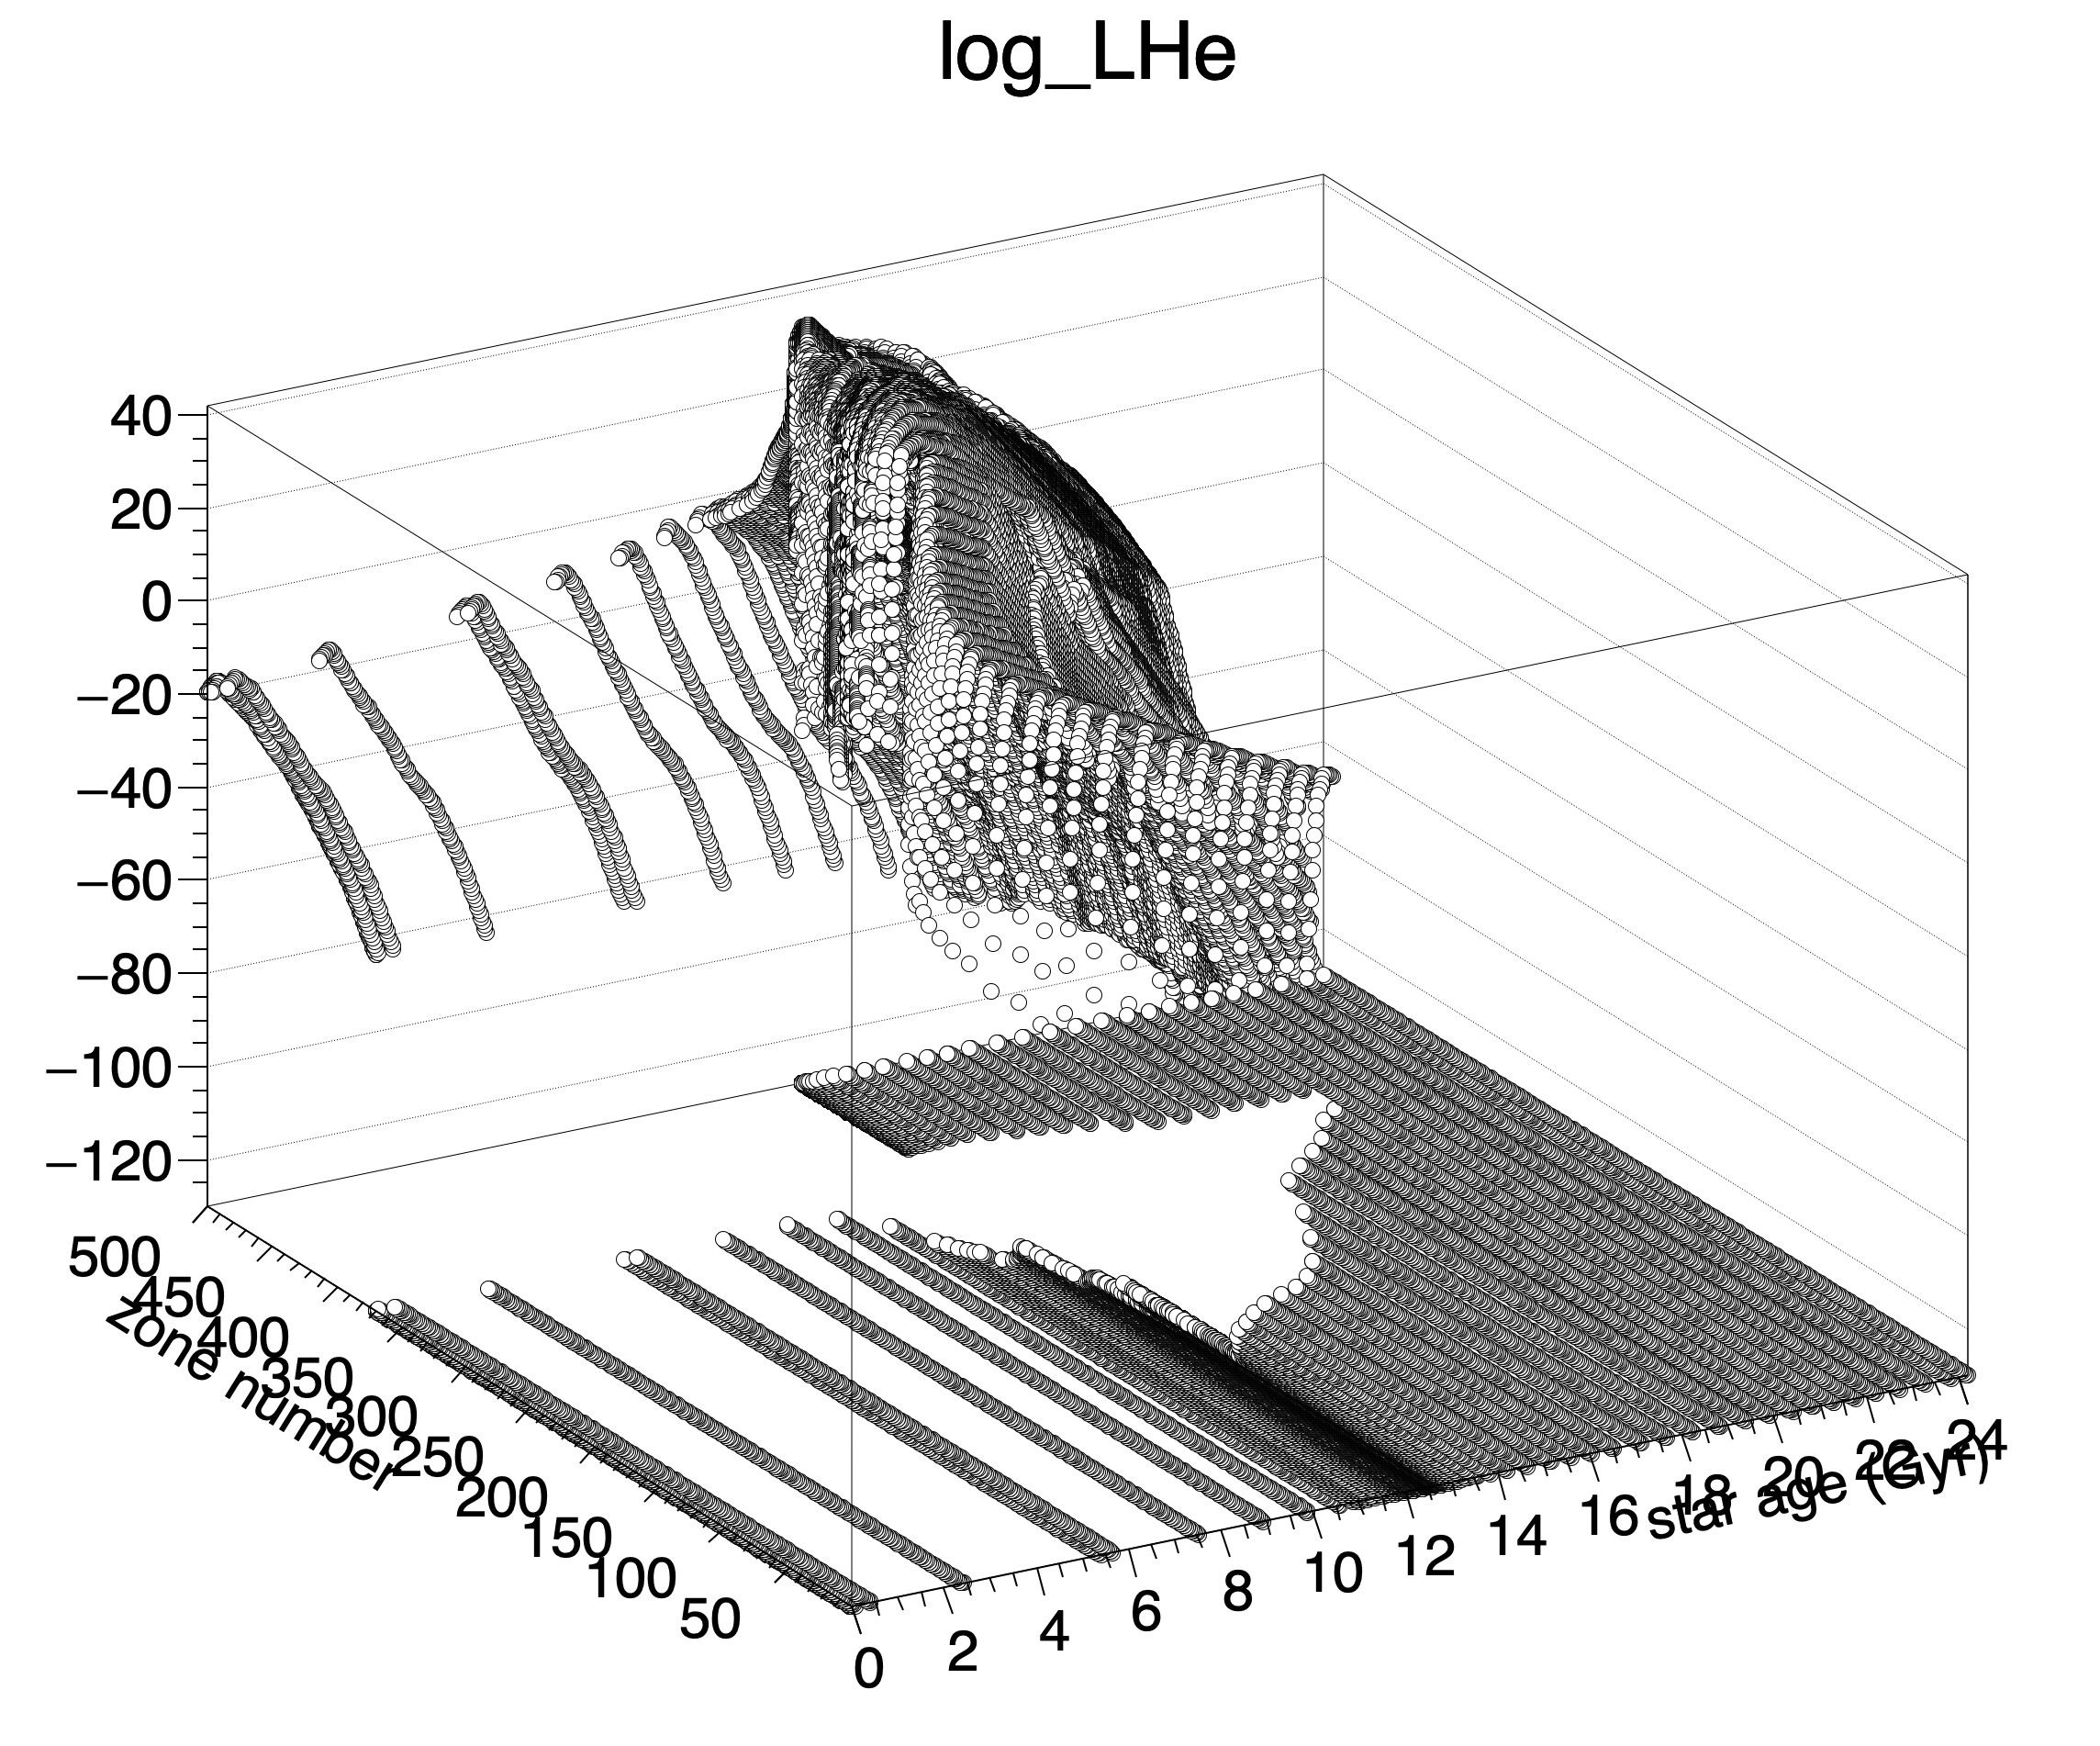
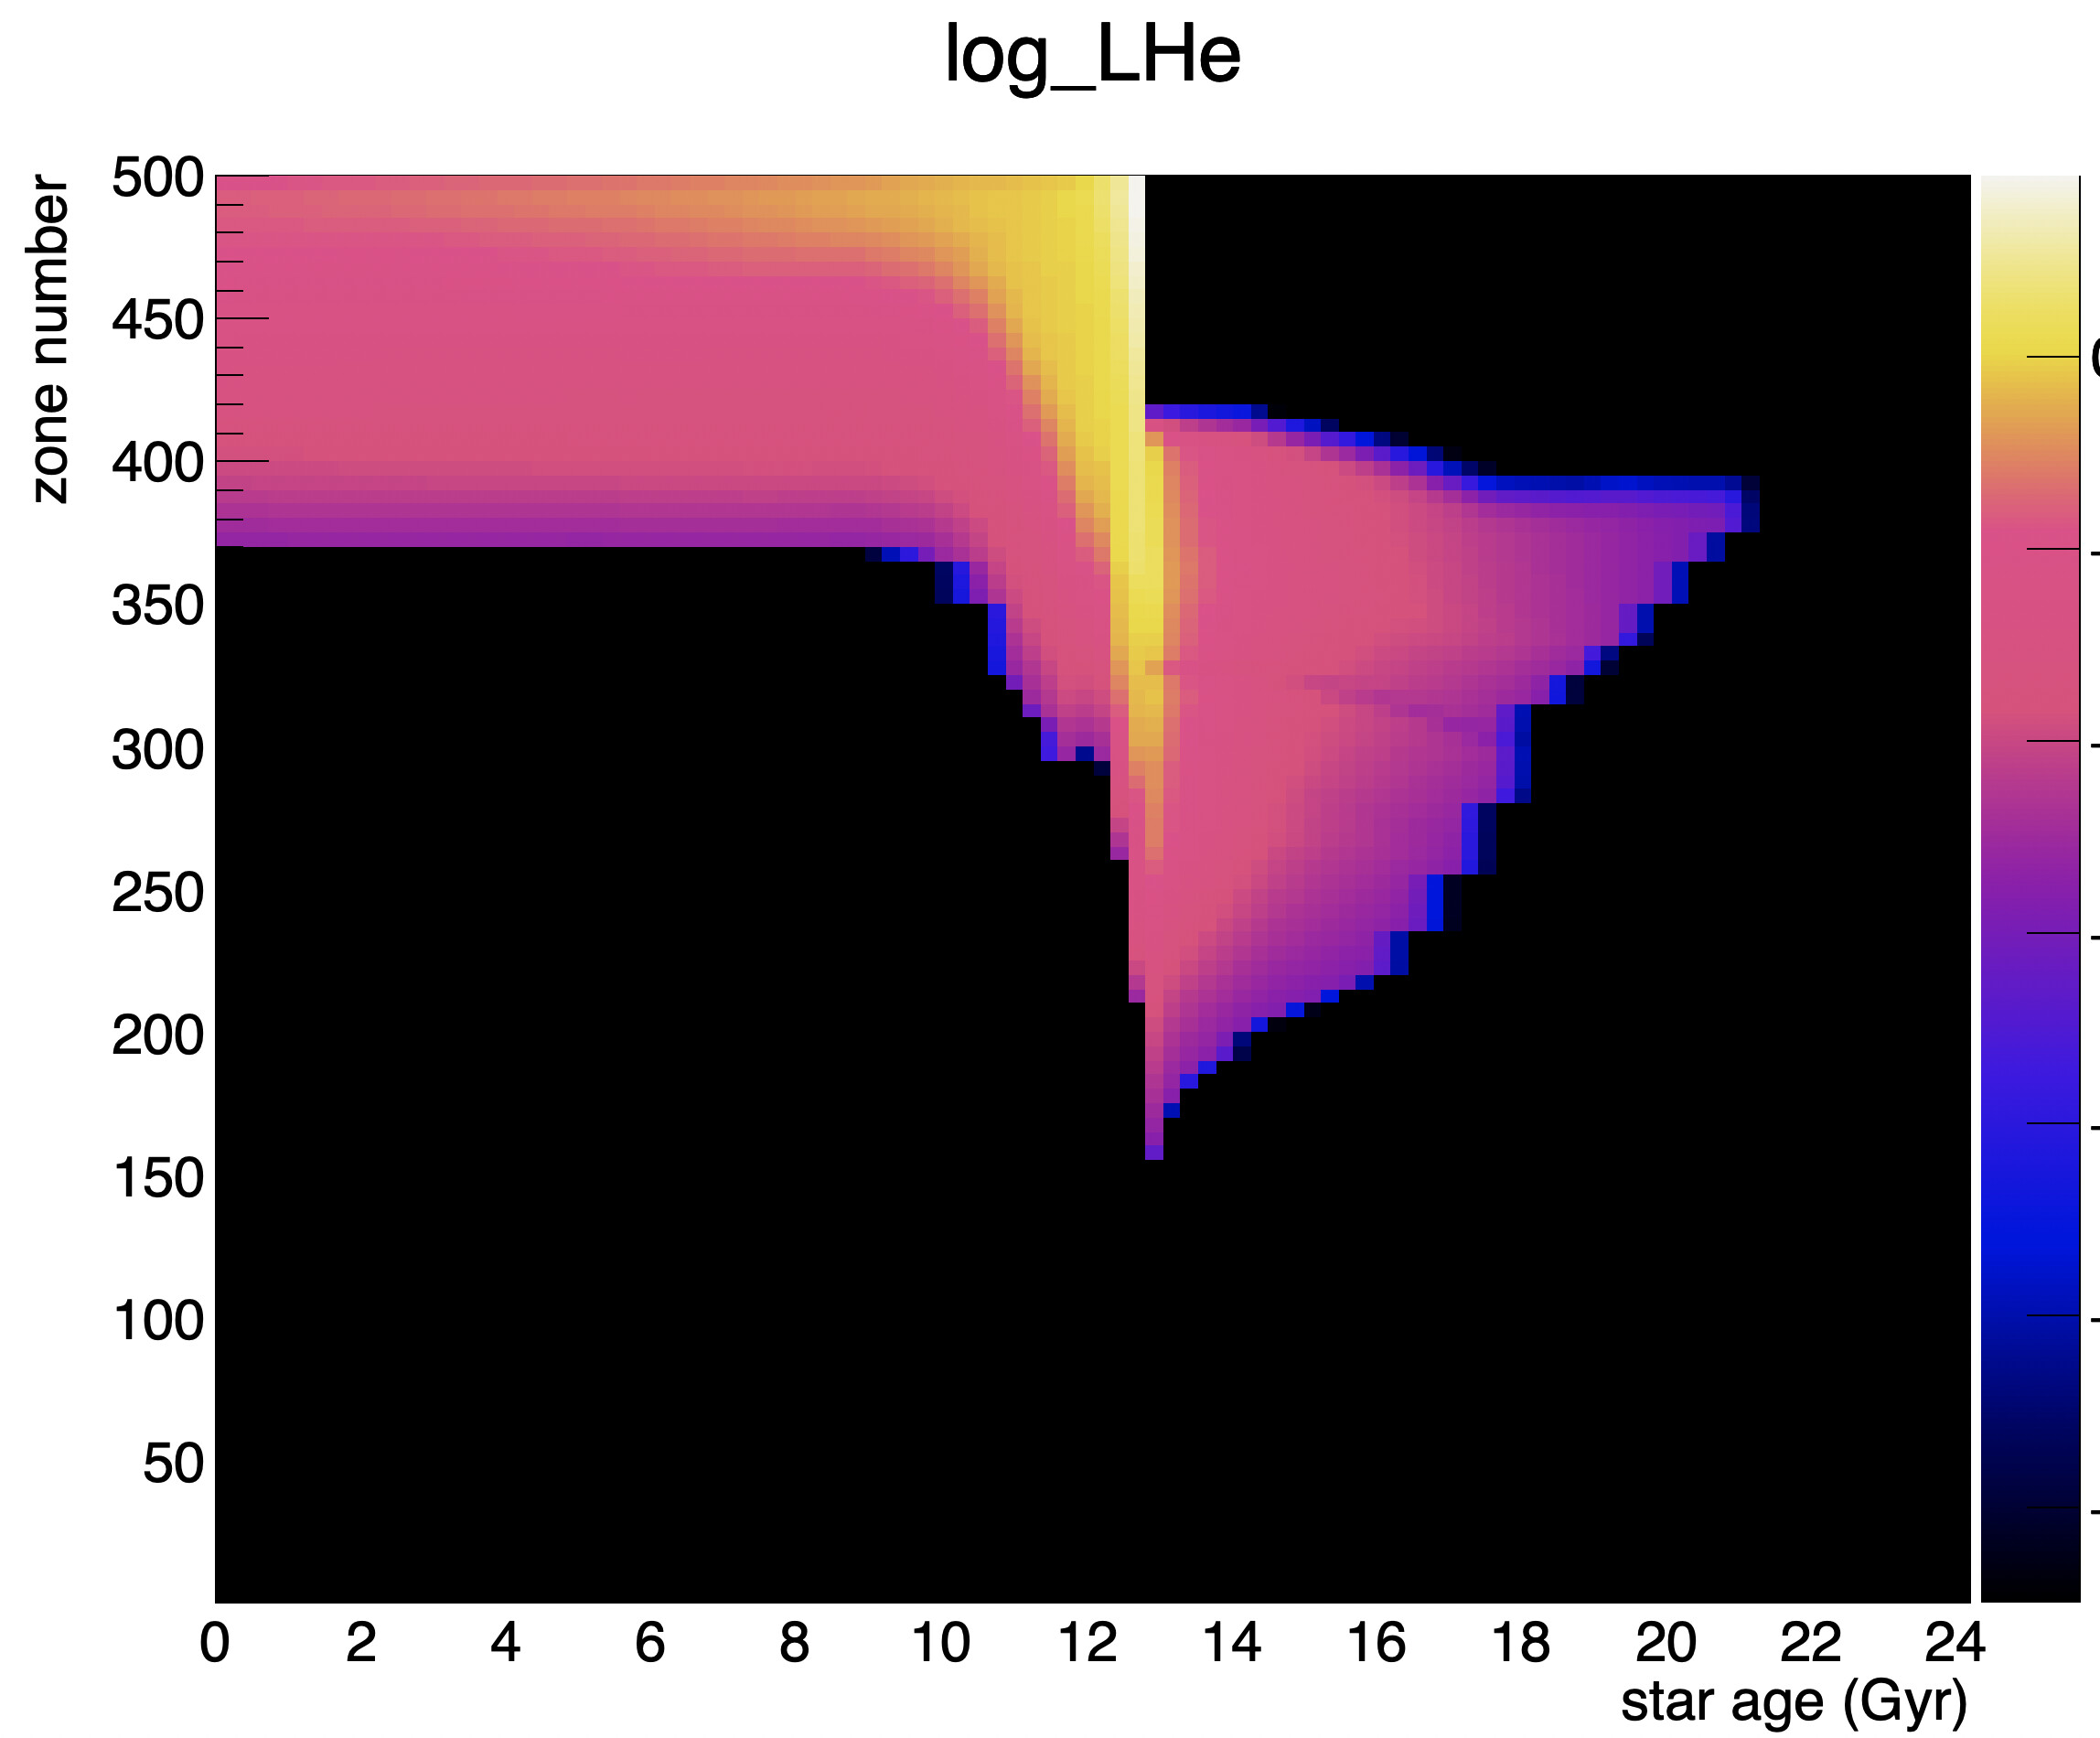
// Creates a plot of the logarithm of the luminosity due to helium burning in a star as a function of time and space
// V2: Added tick marks and labels to denote different evolutionary stages
// V3: Changed number of contourso equal the maximum number of colors for smoother color transitions
// added variable for center

# include <iostream>
# include <fstream>
# include <math.h>
# include <iomanip>
# include <cmath>
# include <stdlib.h>
# include <cstdlib>
//# include <fstream.h>
# include <string.h>
# include <string>
//# include <dos.h> //For Sleep()

# include "TROOT.h"
# include "TFile.h"
# include "TTree.h"
# include "TBrowser.h"
# include "TH1.h"
# include "TH2.h"
# include "TH3.h"
# include "TGraph2D.h"
# include "TRandom.h"
# include "TLine.h"

int main(){

	const char *inputFileName = "log_He_500.dat";

	// ages
   double TAMS_age = 11.17874;
   double RGB_TIP_age = 12.75403;
   double AGB_age = 12.88079;

   // controls
   int palette_number = 62;
   int contour_number = 255;
   bool HB_zoom = false;

   // create the coordinate arrays
   vector<double> ages;
   vector<double> zones;
   vector<double> log_LHes;
   vector<double> dx;
   vector<double> dy;
   vector<double> dz;

   ifstream inFile(inputFileName);

   if (inFile.is_open())cout<<"Input File was opened successfully"<<endl;

   //Main loop filling arrays from file//
   double lineage, linezone, lineHe;
   while (inFile>>lineage>>linezone>>lineHe) {
      ages.emplace_back(lineage);
      zones.emplace_back(linezone);
      log_LHes.emplace_back(lineHe);
      dx.emplace_back(0);
      dy.emplace_back(0);
      dz.emplace_back(0);
   }
   cout << "Read " << ages.size() << " lines\n";
   auto center = max_element(begin(zones), end(zones));
   cout << "Maximum zone (center) is " << *center << endl;
   int center_zone = *center;

   gStyle->SetPalette(palette_number);
  /* const Int_t Number = 3;
   Double_t Red[Number]    = { 1.00, 0.00, 0.00};
   Double_t Green[Number]  = { 0.00, 1.00, 0.00};
   Double_t Blue[Number]   = { 1.00, 0.00, 1.00};
   Double_t Length[Number] = { 0.00, 0.50, 1.00 };
   Int_t nb=1000;
   TColor::CreateGradientColorTable(Number,Length,Red,Green,Blue,nb);
   */
   gStyle->SetNumberContours(contour_number);

   auto c1 = new TCanvas("c1","log_LHe vs zone and age",200,10,1200,1000);

   TGraph2DErrors *gr = new TGraph2DErrors(ages.size(),&ages[0],&zones[0],&log_LHes[0],&dx[0],&dy[0],&dz[0]);
   gr->SetTitle("log_LHe;star age (Gyr);zone number");
   gPad->Modified();
   gr->Draw("colz");
   gPad->Update();

   if (HB_zoom) {
		gr->GetXaxis()->SetRangeUser(RGB_TIP_age-0.2,AGB_age+0.2);
   } else {
		gr->GetXaxis()->SetRangeUser(TAMS_age-0.7,AGB_age+1.0);
   }

   //////////////////////////////////////////// TICK MARKS ////////////////////////////////////////////////////////
   	// TAMS
   auto TAMS = new TLine(TAMS_age,center_zone,TAMS_age,center_zone+6);
   TAMS->SetLineColor(kBlack);
   TAMS->SetLineWidth(2);
   TAMS->Draw();

	// RGB TIP / Start of HB
   auto RGB_TIP = new TLine(RGB_TIP_age,center_zone,RGB_TIP_age,center_zone+6);
   RGB_TIP->SetLineColor(kBlack);
   RGB_TIP->SetLineWidth(2);
   RGB_TIP->Draw();

	// marker
   auto line = new TLine(12.75531,0,12.75531,center_zone);
   line->SetLineColor(kRed);
   line->SetLineWidth(2);
   line->Draw();

   // AGB / End of HB
   auto AGB = new TLine(AGB_age,center_zone,AGB_age,center_zone+6);
   AGB->SetLineColor(kBlack);
   AGB->SetLineWidth(2);
   AGB->Draw();

   //////////////////////////////////////////////////////// LABELS ///////////////////////////////////////////////////////
   auto latex_MS = new TLatex(TAMS_age-0.4,center_zone+8,"MS");
   latex_MS->SetTextSize(0.015);
   latex_MS->Draw();

   if (!HB_zoom){
	   auto latex_RGB = new TLatex(12.00,center_zone+8,"RGB");
	   latex_RGB->SetTextSize(0.015);
	   latex_RGB->Draw();
   }

   auto latex_HB = new TLatex((RGB_TIP_age+AGB_age)/2. ,center_zone+8,"HB");
   latex_HB->SetTextSize(0.015);
   latex_HB->Draw();

   auto latex_AGB = new TLatex(13.00,center_zone+8,"AGB");
   latex_AGB->SetTextSize(0.015);
   latex_AGB->Draw();

	return 0;
}
Here is the input file if you would like to replicate this: log_He_500.dat
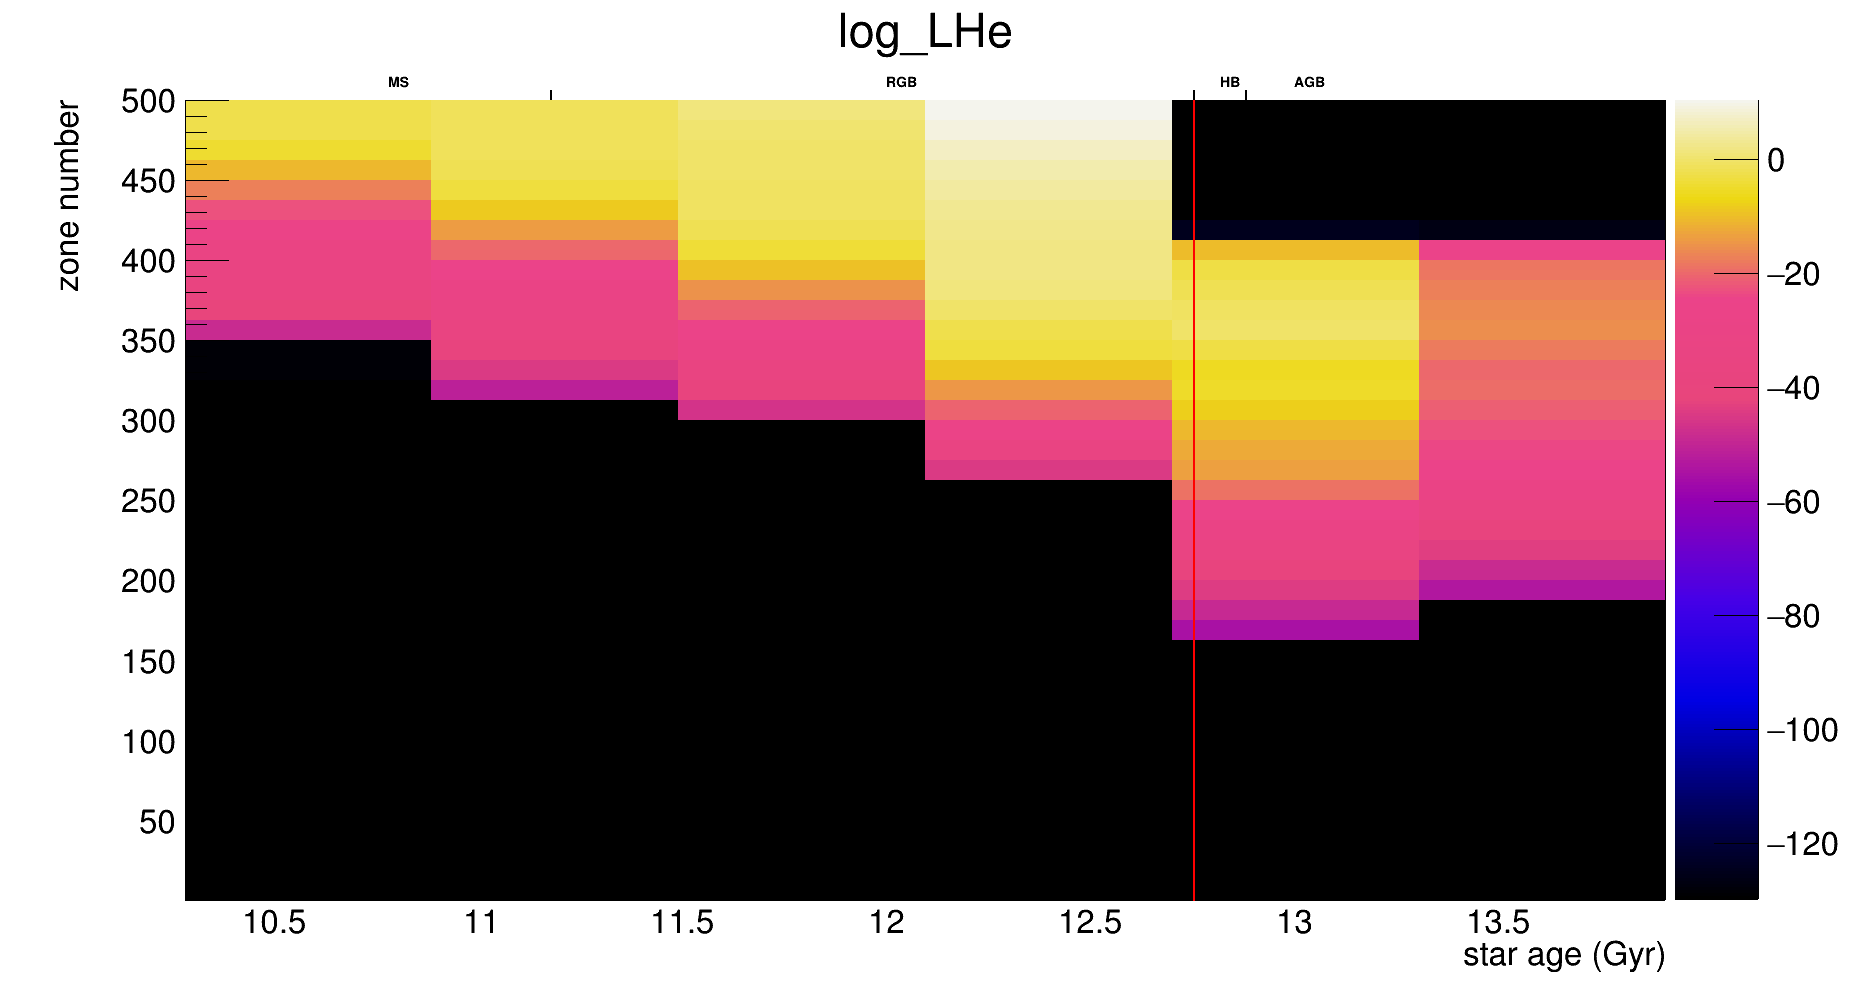
The issue is, under the region labeled “HB” between the ticks, I was expecting to see the highest z values in the upper zones (z ~ 30, you can also verify this yourself in the data file I attached). However, instead the colors indicate with the black color that there are no z values there.
Is this because the range of the color bar is limited? If so, I was wondering if there was a way to change the color bar range so that it represents the full range of z values and doesn’t cut off arbitrarily and affect the accuracy of the colors?
Thanks,
ROOT Version: 6.22/02
Platform: Ubuntu 18.04