Dear ROOT team,
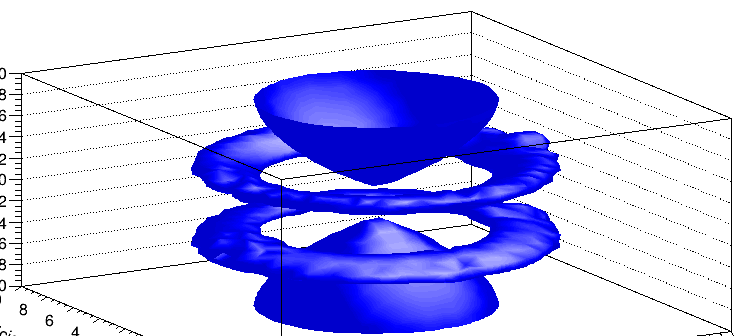
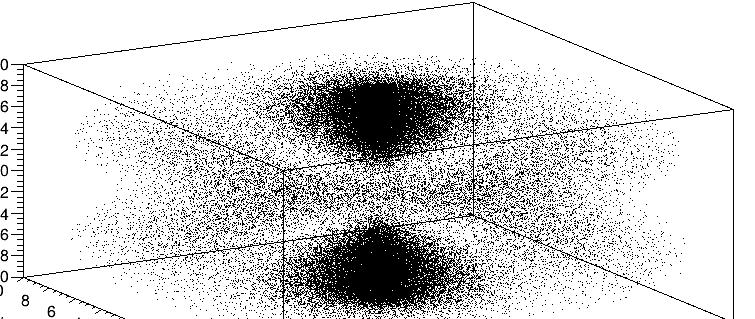
I’m working on visualizing 3D probability density functions using TH3F histograms. When I use Draw("ISO"), I get a solid surface, but I would like to apply a color gradient (heatmap style) to better reflect the variations in density or intensity across the surface.
Is there a way to do this in ROOT?
I’d really appreciate any guidance.
cMain->cd(3);
    hist->SetTitle("Density 3D ");
    hist->GetXaxis()->SetTitle("X");
    hist->GetYaxis()->SetTitle("Y");
    hist->GetZaxis()->SetTitle("Z");
    hist->GetXaxis()->SetTitleOffset(2.0);
    hist->GetYaxis()->SetTitleOffset(2.0);
    hist->GetZaxis()->SetTitleOffset(1.5);
    hist->SetFillColor(kBlue);
    hist->SetLineColor(kBlue);
    hist->Draw("ISO SURF2");
Thank you everyone.
ROOT Version: 6.28/04
Platform: Ubuntu
Compiler: GCC