How to adjust the contrast when drawing graysacle histogram by using TH2D

Hi,
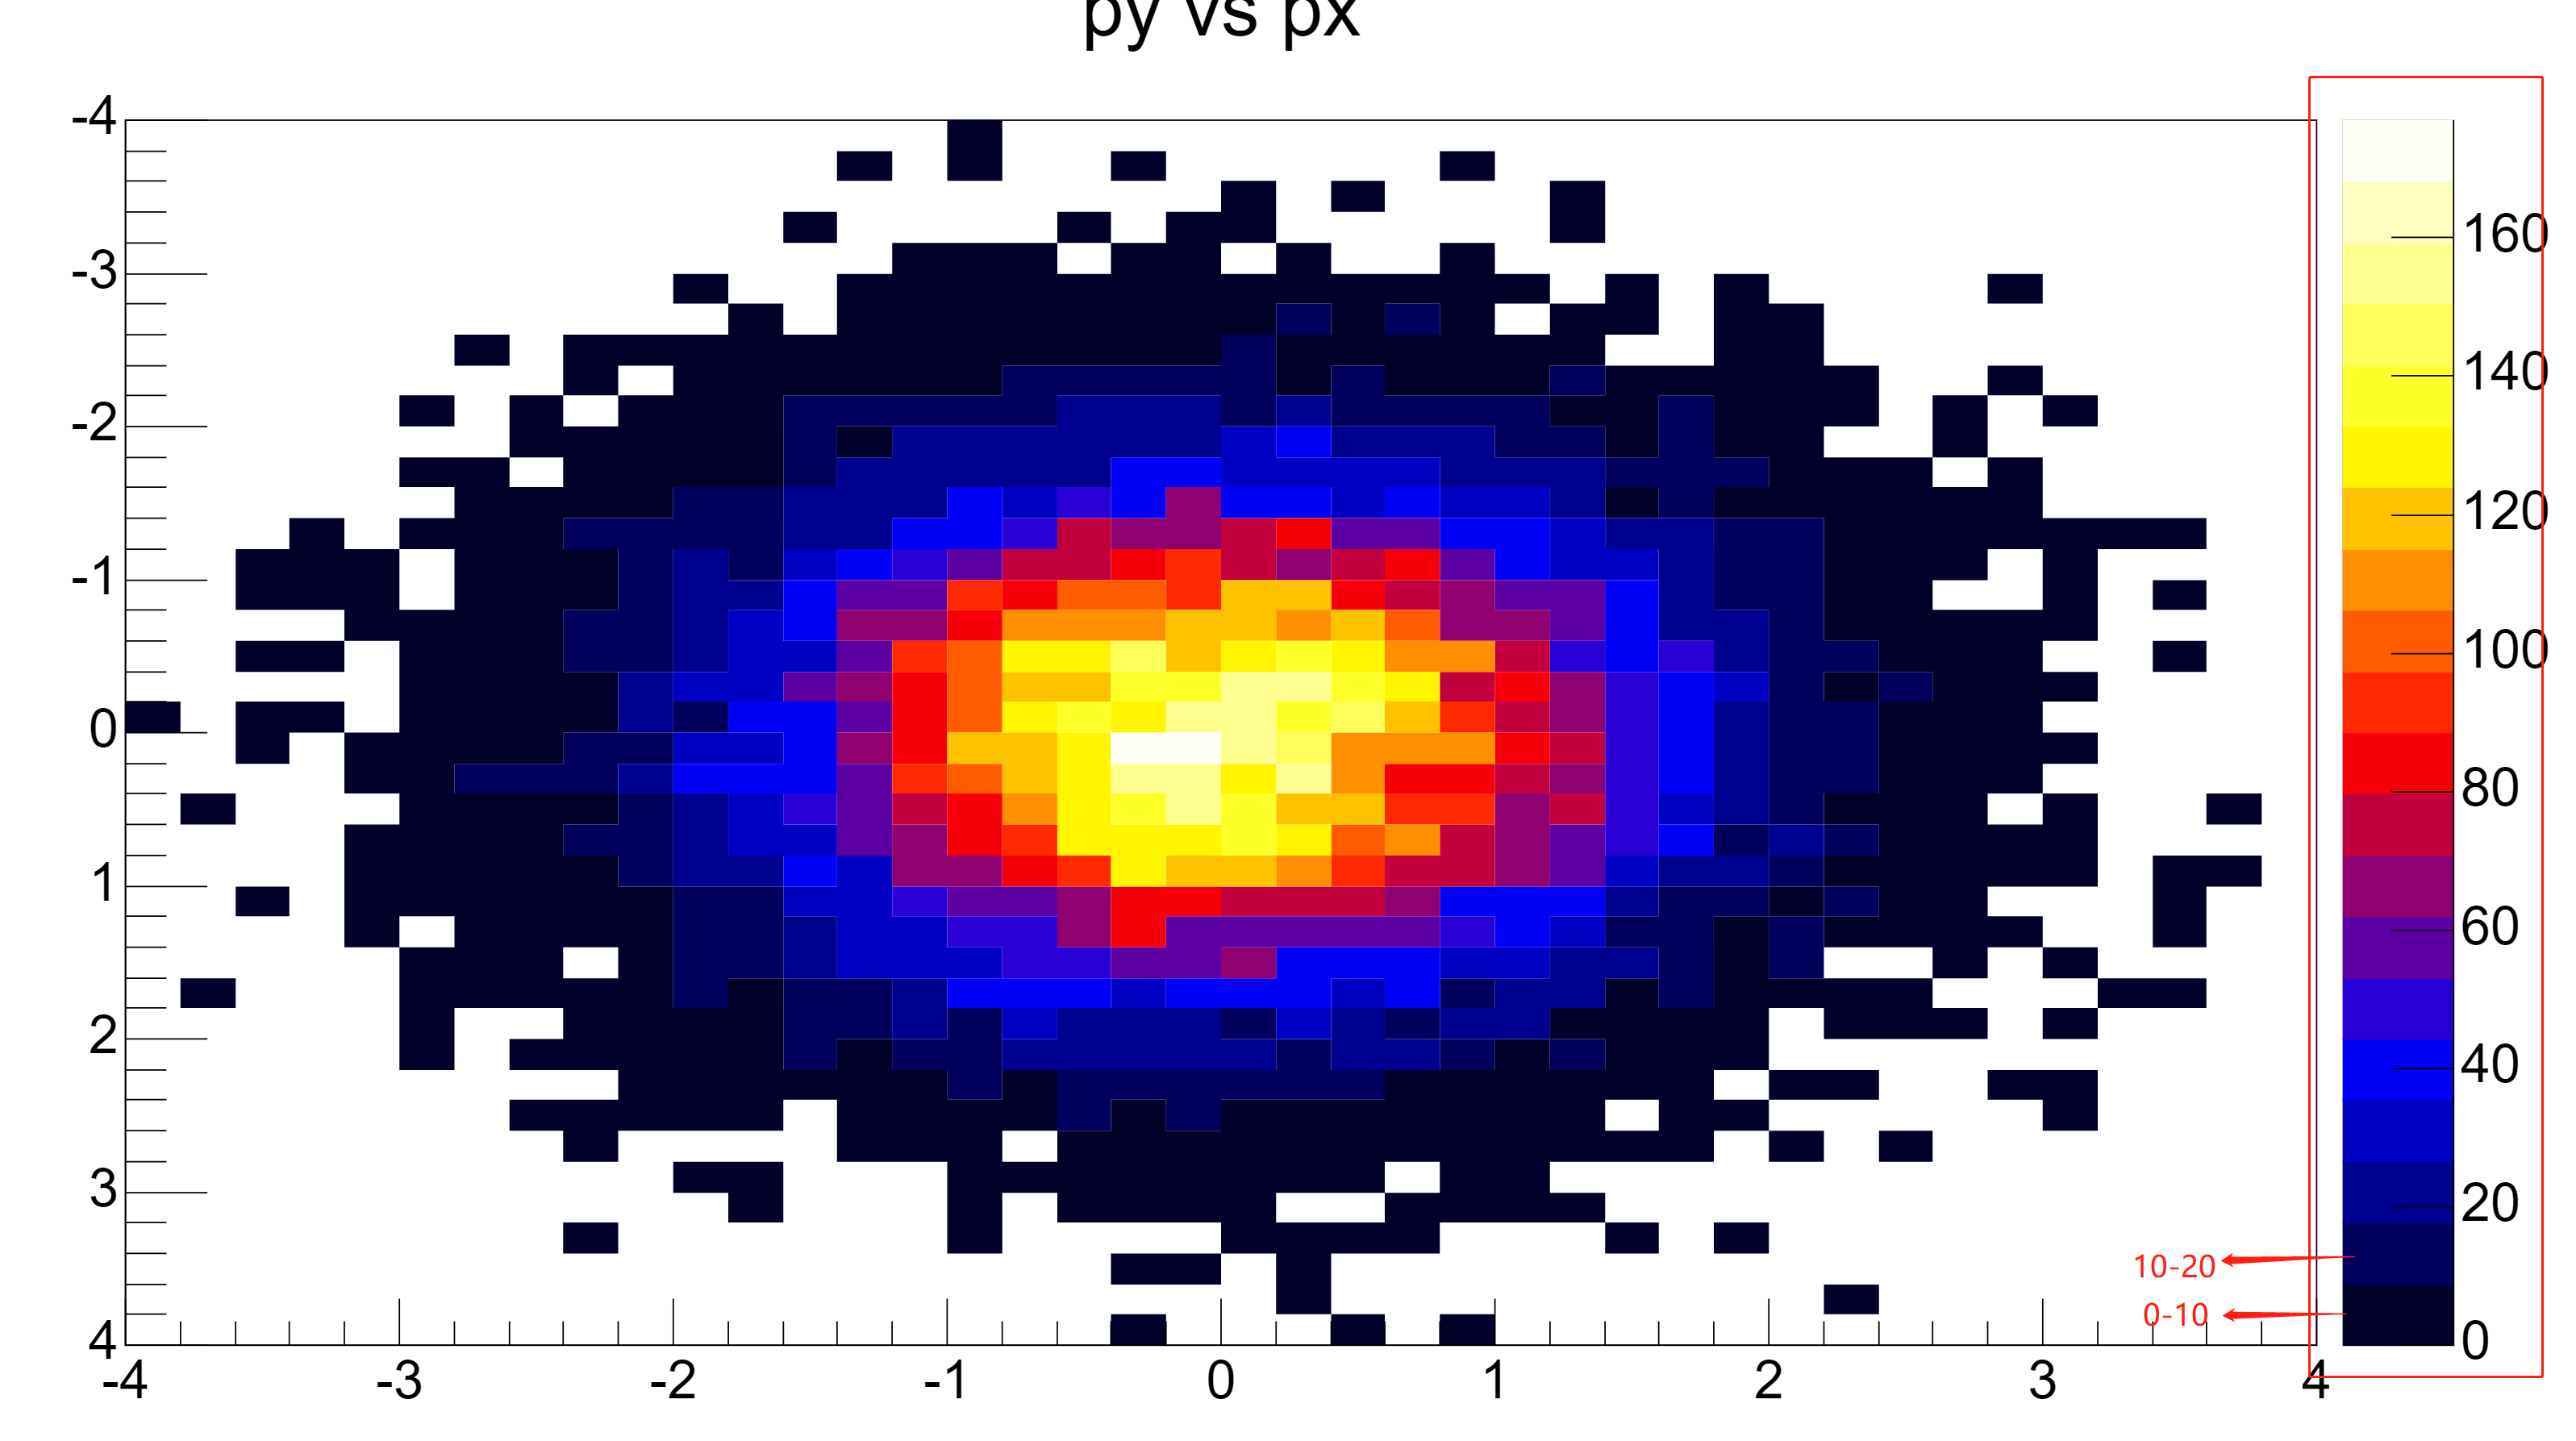
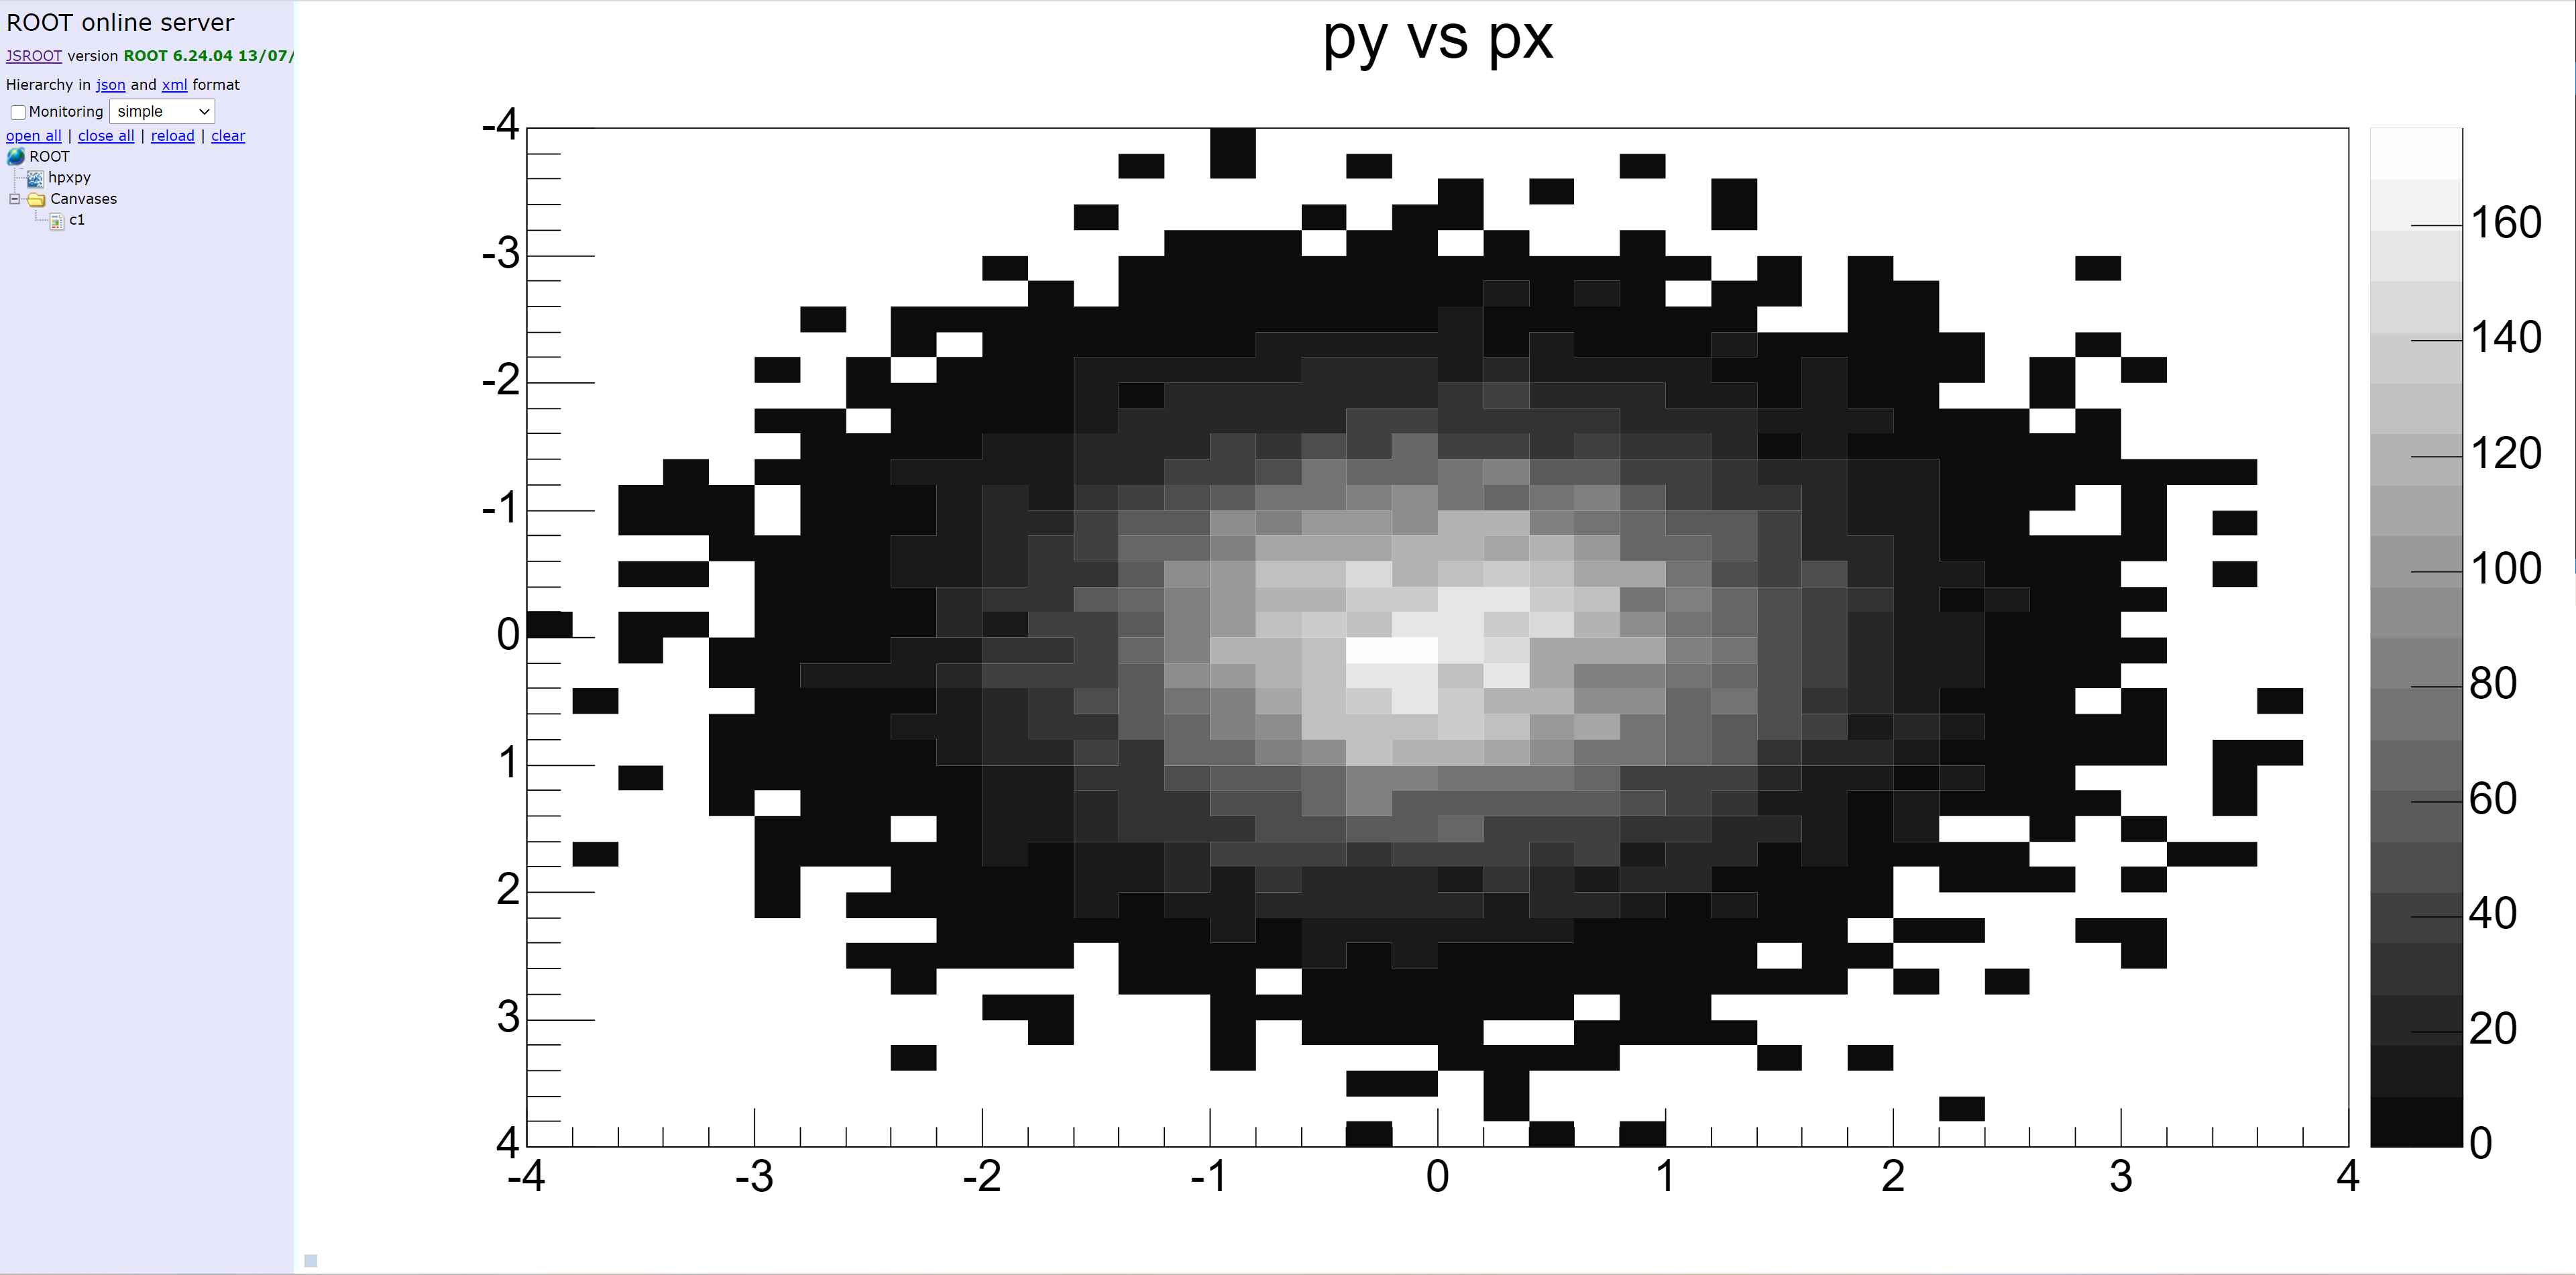
When I use THttpServer to show a TH2D grayscale histogram, I want to change the contrast of the image. What should I do? Thank you.
Here is my code:

int main()
{
    gStyle->SetOptStat(0);
    gStyle->SetPalette(kGreyScale);

    TH2F *hpxpy  = new TH2F("hpxpy","py vs px",40,-4,4,40,-4,4);
    TCanvas *c1 = new TCanvas("c1");
    hpxpy->Draw("ry_colz");
    THttpServer *serv = new THttpServer("http:7777");
    // serv->Register("/", c1);
    serv->SetItemField("/","_monitoring","1000");
    while(1)
    {
        gSystem->ProcessEvents();
        
        {  
            c1->cd(1);
            hpxpy->Reset();
           
            Float_t px, py;
            TRandom r;
            for (Int_t i = 0; i < 25000; i++) {
                
                r.Rannor(px,py);
                hpxpy->Fill(px,py);
            }

        }
        
        
    }
    return 0;
}


ROOT Version: 6.24/06
Platform: Centos7
Compiler: gcc4.8


You can try to go to log scale on the Z axis. But the best way will be to define your own palette.

One of possible solutions is proposed by @couet - use log scale.

JSROOT has only two gray-scale palettes - code 1 and code 52.
Just to draw options code of palette like col,pal52

But in recent JSROOT version 7.5.0 I add support of grayscale flag of TCanvas.
In such case any existing palette will be converted into gray colors.
Just try existing palettes to find suitable for you. Like pal55,grayscale

To use other JSROOT version with THttpServer, just install it on your file system and set JSROOTSYS shell variable to the location.

I donot understand that how to use log scale to adjust contrast, could you provide an example?

One can use “logz” in histogram draw option.
Like col,pal52,logz

canvas->SetLogz();

I recommend to register histogram to server and directly display histogram with draw options I suggest.

Unfortunately, it is not easy to use custom colors and custom color palette with THttpServer, therefore usage of canvas with such settings is not possible. It is only implemented with TWebCanvas class, but it works differently as just plain THttpServer

Thank you for your reply. I got it. According to my understand, using log scale can only show 2 palette grayscale. But I want to show histogram from contrast 1%-100%. What should I do?

I would like to add a slider to dynamically adjust the contrast for a clearer view of histogram details.

Linear gray scale from 0% to 100% is implemented as palette 52. It is just histogram which has much more bins with 0 content and therefore whole drawing is very dark.

This will be more complicated and will require JavaScript/HTML programming and use of some private/non-documented features of JSROOT. But in principle it is possible and if you are interested - I can provide simple prototype of it.

Thank you for your help very much. It would be better if you could provide a simple demo.

I have another question. I want to fix the palette on the right side, and it doesnot change with data.
such as for the first one, it shows 0-10. The second one shows 10-20. I added

gStyle->SetNumberContours(100);

But it seems that it doesnot work well. I want to show like the picture.

Here is my code:

int main()
{
    gStyle->SetOptStat(0);
    gStyle->SetNumberContours(100);
    // gStyle->SetPalette(1);
    Int_t MyPalette[100];
    Double_t Red[]    = {0., 0.0, 1.0, 1.0, 1.0};
    Double_t Green[]  = {0., 0.0, 0.0, 1.0, 1.0};
    Double_t Blue[]   = {0., 1.0, 0.0, 0.0, 1.0};
    Double_t Length[] = {0., .25, .50, .75, 1.0};
    Int_t FI = TColor::CreateGradientColorTable(5, Length, Red, Green, Blue, 100, 1);
    for (int i=0;i<100;i++) MyPalette[i] = FI+i;
    gStyle->SetPalette(100, MyPalette);
    

    TH2F *hpxpy  = new TH2F("hpxpy","py vs px",40,-4,4,40,-4,4);
    TCanvas *c1 = new TCanvas("c1");

    hpxpy->Draw("ry_colz");
    // hpxpy->Draw("ry_colz_pal52_logz");
    THttpServer *serv = new THttpServer("http:7777");
    // serv->Register("/", c1);
    serv->SetItemField("/","_monitoring","1000");
    while(1)
    {
        gSystem->ProcessEvents();
        
        
        {  
            c1->cd(1);
            hpxpy->Reset();
           
            Float_t px, py;
            TRandom r;
            for (Int_t i = 0; i < 25000; i++) {
                
                r.Rannor(px,py);
                hpxpy->Fill(px,py);
            }

            // canvas->SetLogz();

        }
        
        
    }
    return 0;
}

Linear gray scale from 0% to 100% is implemented as palette 52. It is just histogram which has much more bins with 0 content and therefore whole drawing is very dark.

Sorry to borther you again. I donot know how should I show the histogram in 50% contrast. Could you provide an example?

Hi,

Please try to configure custom contour levels for the histogram.
See TH1::SetContour method.
There you can define custom levels. It also should work with THttpServer.

But again - many small details in graphics does not work with plain JSROOT and THttpServer.
Only new web-based canvas covers all such details.
You can try it just with running root --web and just creating and drawing normal TCanvas.
You do not need to instantiate THttpServer - it is automatically done by web-canvas.
And to get all latest features you will have to use root 6.30 - which will be released soon.

Try to use SetContour method first - probably it will solve your problem.

Thank you. According to your advice, I will update my code by using TWebCanvas later. But The website https://root.cern.ch/ does not provide an example how to use TWebCanvas.

And now I added the TH1::SetContour, but it doesnot work. I find an example to use this one in JSROOT th2_cjust. Where can I see the source code?

int main()
{
    gStyle->SetOptStat(0);
    

    TH2F *hpxpy  = new TH2F("hpxpy","py vs px",40,-4,4,40,-4,4);
    Double_t contourLevels[] = {0.0, 10.0, 20.0, 30.0, 40.0, 50.0, 60.0, 70.0, 80.0, 90.0, 100.0, 110.0, 120.0};

    hpxpy->SetContour(13, contourLevels);
    TCanvas *c1 = new TCanvas("c1");

    TString options = "ry_colz_pal52"; // 设置绘图选项
    hpxpy->Draw(options); // 使用选项绘制图形
    THttpServer *serv = new THttpServer("http:7777");
    serv->Register("/", c1);
    serv->SetItemField("/","_monitoring","1000");
    while(1)
    {
        gSystem->ProcessEvents();
        
        
        {  
            c1->cd(1);
            hpxpy->Reset();
           
            Float_t px, py;
            TRandom r;
            for (Int_t i = 0; i < 25000; i++) {
                
                r.Rannor(px,py);
                hpxpy->Fill(px,py);
            }

            // canvas->SetLogz();

        }
        
        
    }
    return 0;
}
···

Here is example how you can define custom contour:

int server()
{
    gStyle->SetOptStat(0);

    TH2F *hpxpy  = new TH2F("hpxpy","py vs px",40,-4,4,40,-4,4);
    Double_t levels[15] = {0.0, 0.05, 0.01, 0.15, 0.2, 0.25, 0.3, 0.35, 0.4, 0.5, 0.6, 0.7, 0.8, 0.9, 1};

    THttpServer *serv = new THttpServer("http:7777");
    serv->Register("/", hpxpy);

    TRandom r;
    serv->SetItemField("/","_monitoring","1000");
    serv->SetItemField("/","_drawitem","hpxpy");
    serv->SetItemField("/","_drawopt","colz_pal52_grayscale");

    while (!gSystem->ProcessEvents()) {
       Float_t px, py;
       for (Int_t i = 0; i < 1000; i++) {
           r.Rannor(px,py);
           hpxpy->Fill(px,py);
       }
       auto max = hpxpy->GetMaximum();
       Double_t contourLevels[15];
       for (Int_t i = 0; i < 15; i++)
          contourLevels[i] = levels[i] * max;

       hpxpy->SetContour(15, contourLevels);
    }

    return 0;
}

Levels should be adjusted to histogram content to correctly scale.

Thank you very much for your help. I understand how to adjust contour in JSROOT. Could you provide me a simple prototype for adding slider to adjust the contour if possible?

Do you want to be able change contour in ROOT histogram on the server side or it is enough to change contour levels and palette only on the client side - in the browser. In second case one also can implement any kind of palette.

I create custom html page which regularly request histogram from the server and provides slider
to configure color palette for histogram drawing.
slider.htm.txt (1.7 KB)

You only need to add following line to the ROOT macro:

    serv->SetDefaultPage("slider.htm");

When creating palette one just specify list of colors.
Moving slider, different kinds of colors are created.

Thank you a lot.

But when I added this line serv->SetDefaultPage("slider.htm"); and viewed the webpage http://127.0.0.1:7777, I found that only the slider was displayed without a histogram like the following picture:

My code is here

int server
{
gStyle->SetOptStat(0);

    TH2F *hpxpy  = new TH2F("hpxpy","py vs px",40,-4,4,40,-4,4);
    Double_t levels[15] = {0.0, 0.05, 0.01, 0.15, 0.2, 0.25, 0.3, 0.35, 0.4, 0.5, 0.6, 0.7, 0.8, 0.9, 1};

    THttpServer *serv = new THttpServer("http:7777");
    serv->Register("/", hpxpy);

    TRandom r;
    serv->SetItemField("/","_monitoring","1000");
    serv->SetItemField("/","_drawitem","hpxpy");
    serv->SetItemField("/","_drawopt","colz_pal52_grayscale");
    // serv->SetDefaultPage("slider.htm");

    while (!gSystem->ProcessEvents()) {
       Float_t px, py;
       for (Int_t i = 0; i < 1000; i++) {
           r.Rannor(px,py);
           hpxpy->Fill(px,py);
       }
       auto max = hpxpy->GetMaximum();
       Double_t contourLevels[15];
       for (Int_t i = 0; i < 15; i++)
          contourLevels[i] = levels[i] * max;

       hpxpy->SetContour(15, contourLevels);
    }

    return 0;
}

Problem is your older ROOT version.

Meanwhile JSROOT v7.0 switched to ES6 modules and I provide an example based on this functionality.

Can you upgrade your ROOT to latest 6.28.08 release?
It includes JSROOT v 7.3.