And if I include the same code in the example you deleted I get:
TLegend *legend1, *legend2;
void doublelegendinit(double x1, double y1, double x2, double y2) {
double dx = 0.02;
legend1 = new TLegend(x1, y1, x2, y2);
legend1->SetLineWidth(0);
legend1->SetFillStyle(0);
legend1->Draw();
legend2 = new TLegend(x1-dx, y1, x2-dx, y2);;
legend2->SetLineWidth(0);
legend2->SetFillStyle(0);
legend2->Draw();
}
void doublelegendaddentry(TGraphErrors *g1, TGraphErrors *g2, TString l) {
legend1->AddEntry(g1,l.Data(),"P");
g2->SetTitle("");
legend2->AddEntry(g2,"","P");
}
void Figure() {
auto c1 = new TCanvas("c1", "Fig-1", 800, 900);
c1->SetLeftMargin(0.2);
c1->SetLogx();
c1->SetLogy();
// draw a frame to define the range for the upper pad
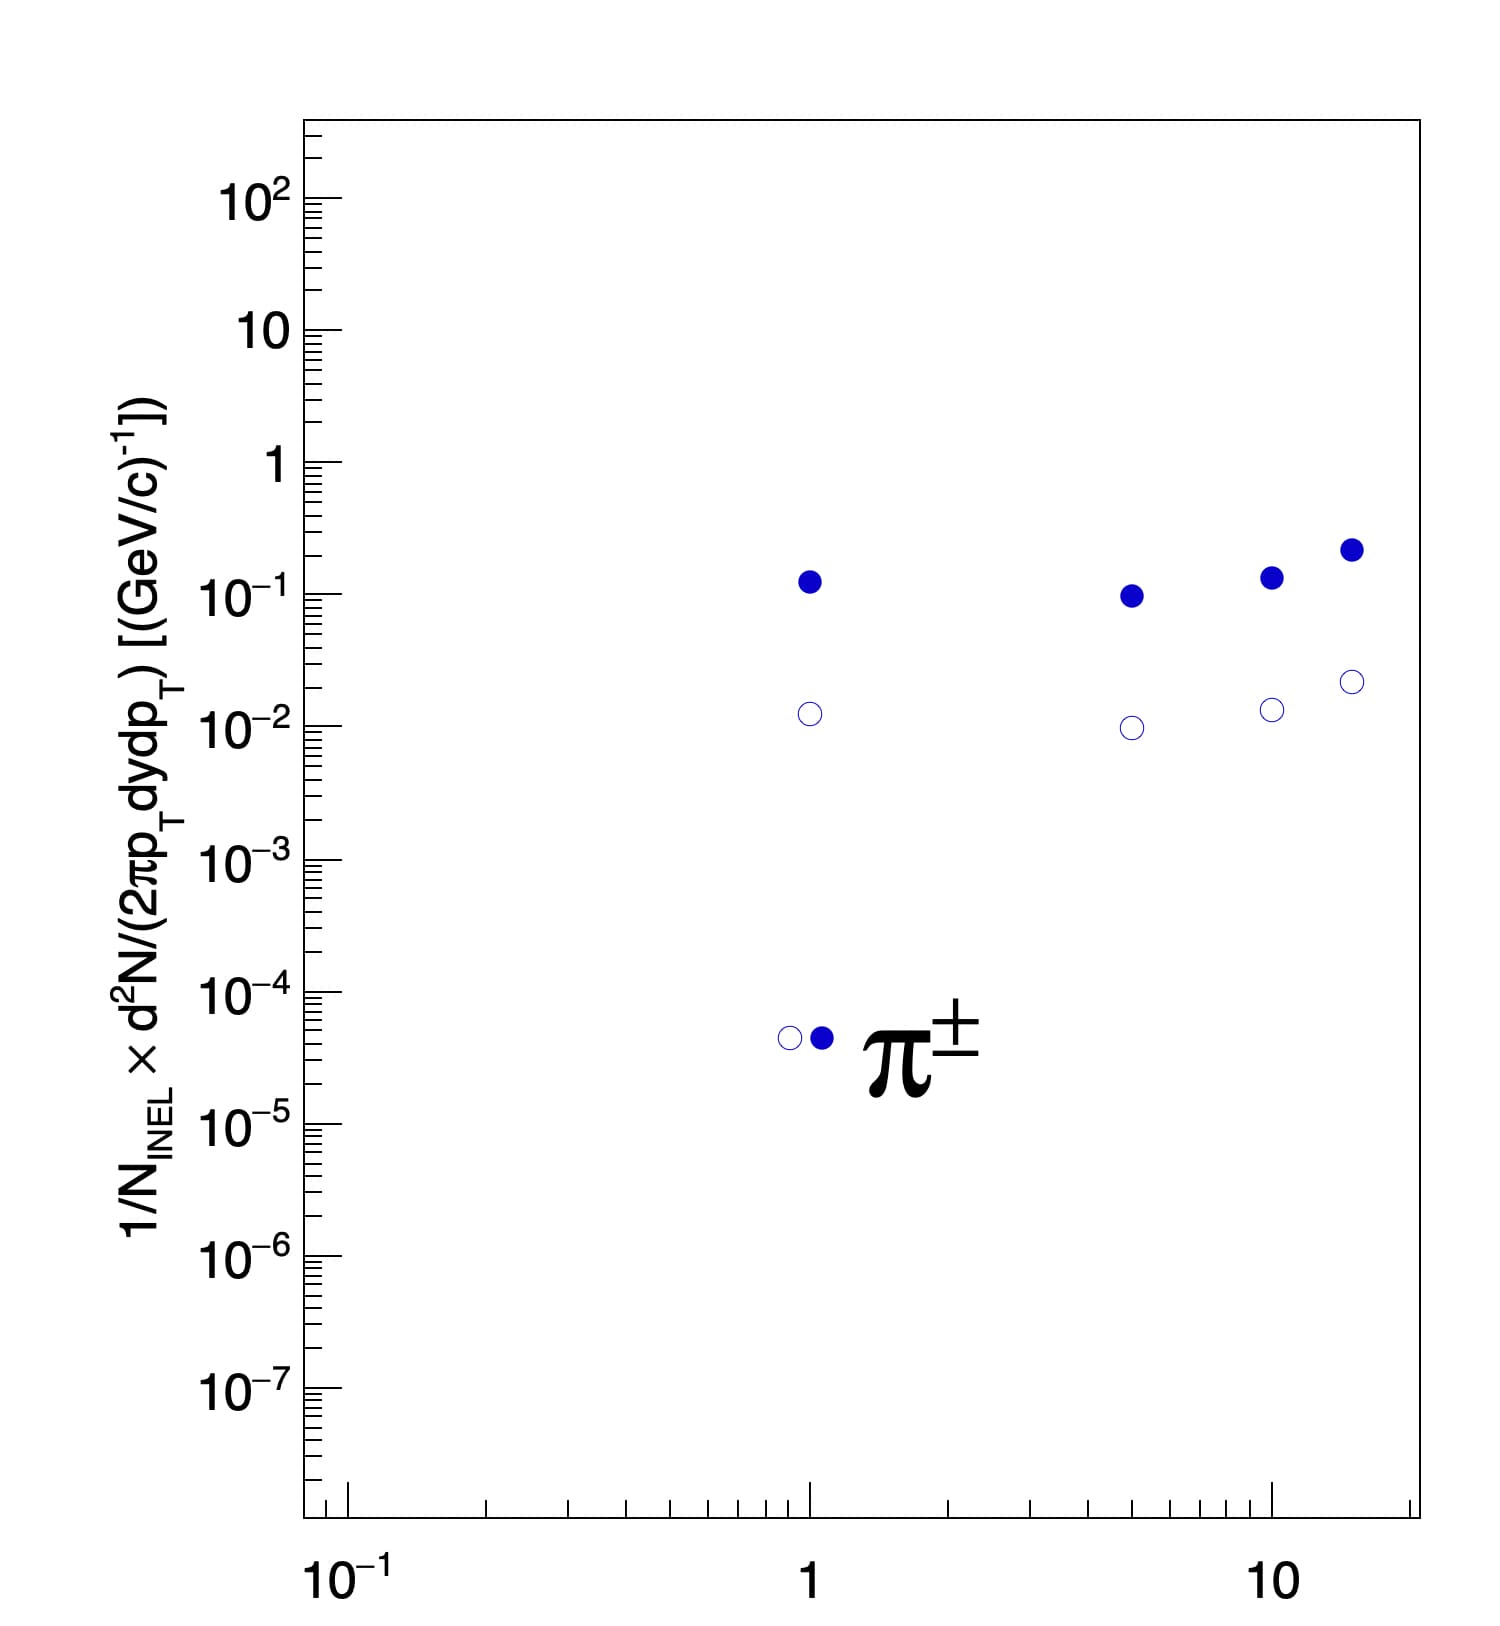
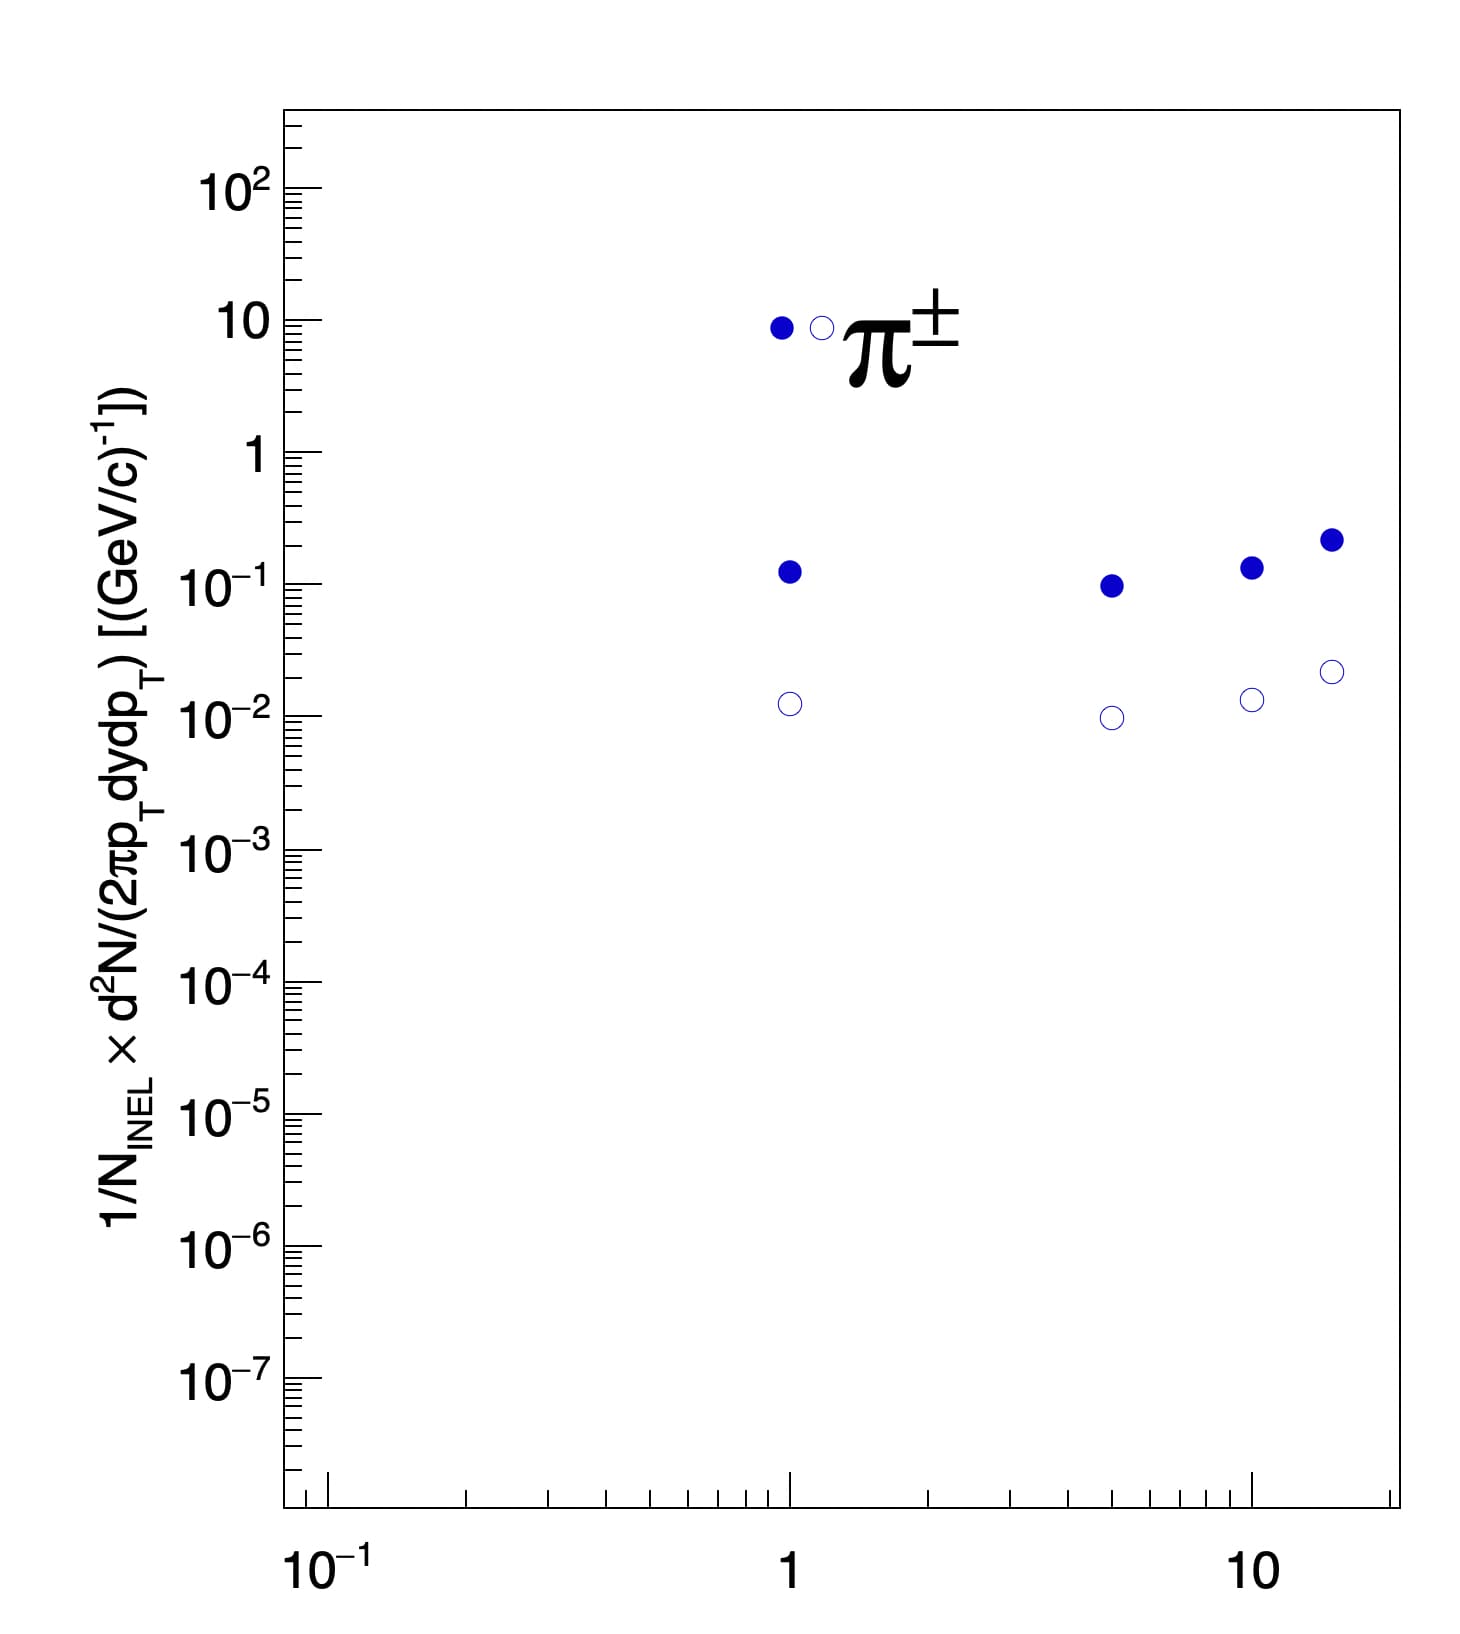
TH1F *frame = c1->DrawFrame(0.08, 0.0000000101, 21., 400);
frame->SetYTitle("1/N_{INEL} #times d^{2}N/(2#pip_{T}dydp_{T}) [(GeV/c)^{-1}])");
frame->GetYaxis()->SetTitleOffset(1.75); // Adjust the offset to center the title
frame->GetYaxis()->CenterTitle(true);
//13 TeV------------------------------------------------------------------------------------------------------------------------------
// EPOS-LHC
const int n1_points = 4;
double x1_vals[n1_points] = {1,5,10,15};
double y1_vals[n1_points] = {0.123457, 0.097534, 0.135487, 0.22235};
double x1_errs[n1_points] = {0,0,0,0};
double y1_errs[n1_points] = {0,0,0,0};
TGraphErrors* graph1 = new TGraphErrors(n1_points, x1_vals, y1_vals, x1_errs, y1_errs);
graph1->SetMarkerColor(kBlue+1);
graph1->SetMarkerStyle(20);
graph1->SetMarkerSize(1.4);
graph1->Draw("p");
//7 TeV------------------------------------------------------------------------------------------------------------------------------
// EPOS-LHC
const int n2_points = 4;
double x2_vals[n2_points] = {1,5,10,15};
double y2_vals[n2_points] = {0.0123457, 0.0097534, 0.0135487, 0.022235};
double x2_errs[n2_points] = {0,0,0,0};
double y2_errs[n2_points] = {0,0,0,0};
TGraphErrors* graph2 = new TGraphErrors(n2_points, x2_vals, y2_vals, x2_errs, y2_errs);
graph2->SetMarkerColor(kBlue+1);
graph2->SetMarkerStyle(24);
graph2->SetMarkerSize(1.4);
graph2->Draw("p");
doublelegendinit(0.5,0.3,0.7,0.45);
doublelegendaddentry(graph1,graph2,"#pi^{#pm}");
}