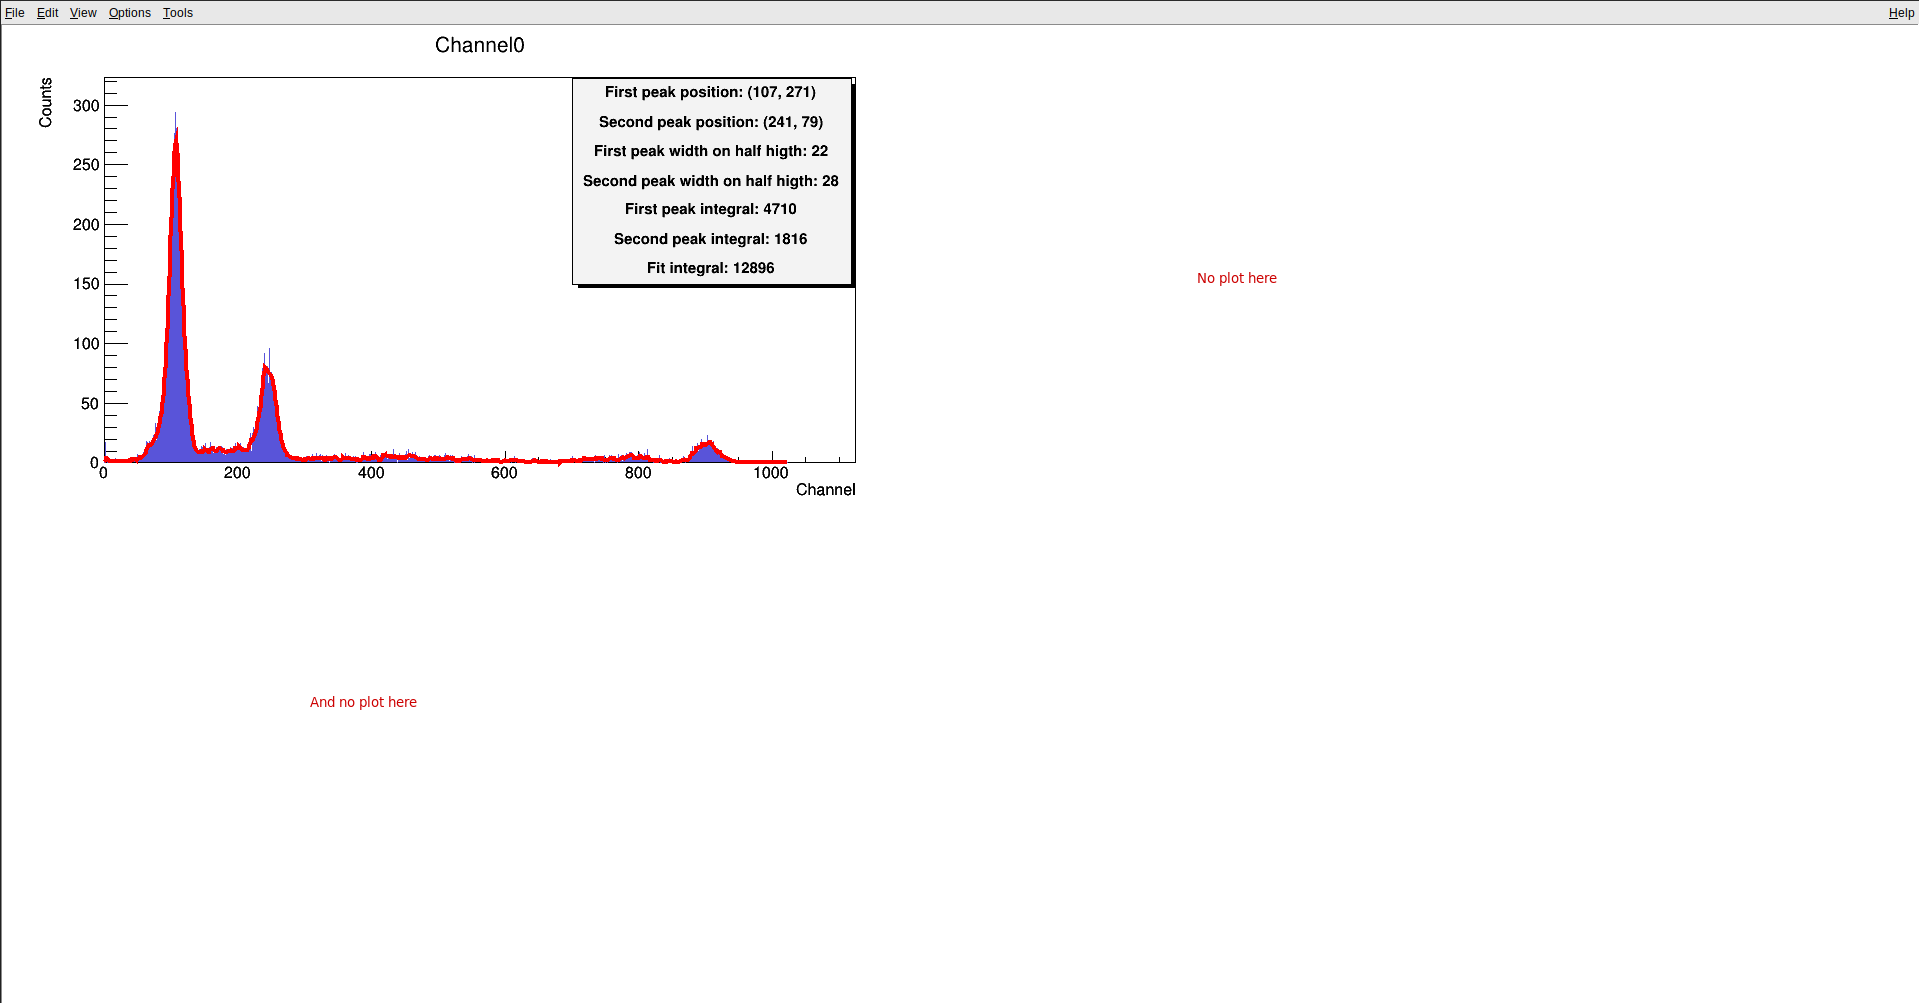
Hi, I’m new to ROOT and I can’t find a solution to my problem. I need to put several plots onto one canvas, but i end up having strange results (e.g only one pad has a graph, but the other one is empty)
Here is a piece of code responsible for drawing:
def draw_channel(self, spectr):
		spectrum = spectr
		data     = spectrum.data_mean
		data_fit = spectrum.fitting

		pave = ROOT.TPaveText(700, 150, 1119, 322)

        ***
        Adding text to pave
        ***

		fit    = ROOT.TGraph()
		no_fit = ROOT.TGraph()

        ***
        Adding points to TGraphs
        ***

		no_fit.SetTitle(f"Channel{spectrum.channel};Channel;Counts")

		no_fit.DrawClone("AB")
		fit.DrawClone("L")
		pave.DrawClone("BR")

		return no_fit, fit, pave


def draw_subplots(self):
		C = ROOT.TCanvas("C", "canvas", 1920,1080)

		spread = self.spectrums # a list that contains spectrum objects

		Nx, Ny = 2, 2
		Margin = 0.005

		C.Divide(Nx,Ny,Margin,Margin)

		for indx, spectr in enumerate(spread, 1):
			C.cd(indx)
			nf, f, p = self.draw_channel(spectr)
You script does not seems complete.
Here is a trivial one doing what you want. It works.
{
   auto g1 = new TGraph();
   auto g2 = new TGraph();
   auto g3 = new TGraph();

   g1->AddPoint(1.,1.);
   g2->AddPoint(1.,1.);
   g3->AddPoint(1.,1.);

   auto c = new TCanvas();
   c->Divide(2,2);
   c->cd(1); g1->Draw("A*");
   c->cd(2); g2->Draw("A*");
   c->cd(3); g3->Draw("A*");
}
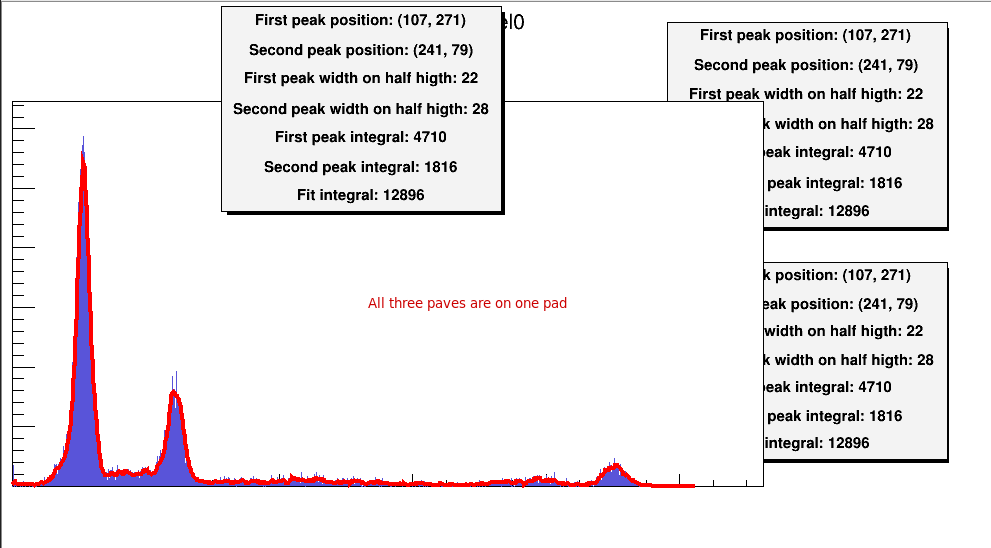
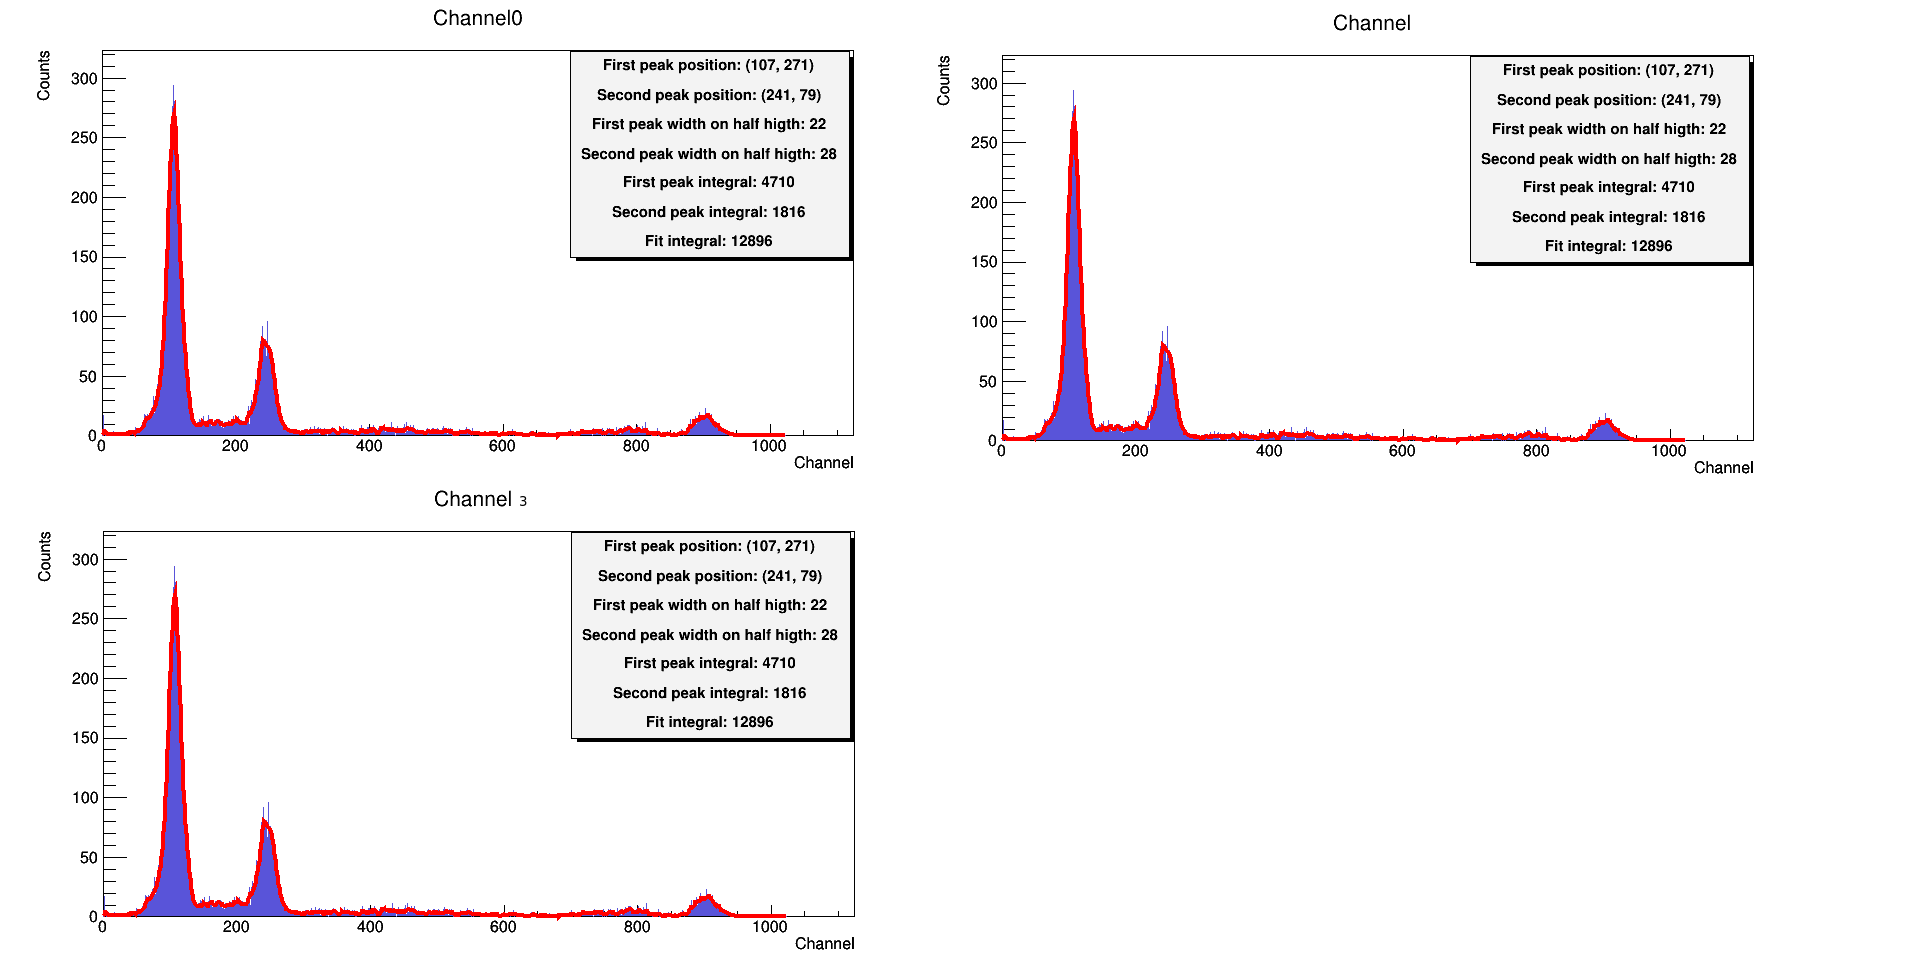
Thanks for the reply. Here what I’ve done to fix this issue:
def draw_channel(self, spectr):
		spectrum = spectr
		data     = spectrum.data_mean
		data_fit = spectrum.fitting

		fit    = ROOT.TGraph()
		no_fit = ROOT.TGraph()

        ***
        Adding points to TGraphs
        ***

		no_fit.SetTitle(f"Channel{spectrum.channel};Channel;Counts")

		# Not drawing here but returning TGraph objects below


		return no_fit, fit


def draw_subplots(self):
		C = ROOT.TCanvas("C", "canvas", 1920,1080)

		spread = self.spectrums # a list that contains spectrum objects

		Nx, Ny = 2, 2
		Margin = 0.005

		C.Divide(Nx,Ny,Margin,Margin)
		sav = [] # added to save TGraph objects so they wouldn't be deleted by garbage collector
		for indx, spectr in enumerate(spread, 1):
			C.cd(indx)
			nf, f= self.draw_channel(spectr)
            nf.Draw("AB")
			f.Draw("L")
			sav.append([nf, f])
And paves got stacked together because I placed them in one spot when initializing