Hi experts!
I wanna get scatter plot of coincidence event between one event location and others event locations.
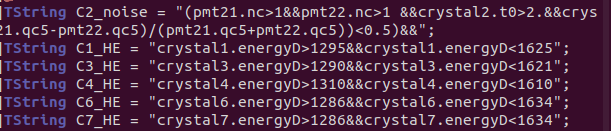
I wanna set the X axis to C2_noise.
And i wanna set the Y axis to C1_HE,C3_HE,C4_HE,C6_HE,C7_HE .
How can i set these?
__
Please read tips for efficient and successful posting and posting code
ROOT Version: Not Provided
Platform: Not Provided
Compiler: Not Provided
Hi @HyungJoe_Kwon ,
ROOT’s class to draw scatter plots is TGraph: ROOT: TGraph Class Reference , see the docs and the related graphs tutorials at ROOT: Graphs tutorials .
Cheers,
Enrico
couet
3
You didn’t tell anything about your data format. Is it it vectors ? Trees ? in case of the later you can simply use TTree::Draw:
T->Draw("y:x")
The data format is tree.
Than before type T->Draw(“y:x”)
May i define the x and y?